The draw of the decent premiums for somewhat measured risk drew me back to UWM again today. Actually I was drawn in yesterday, but the order hit today.
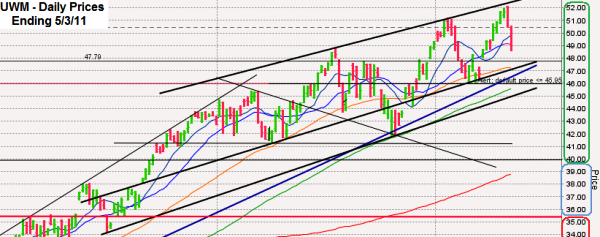
As I mentioned in my April summary yesterday I was planning to increase my exposure. After spending more time on individual stocks and focused ETFs in April I wanted to come back to revisit an index ETF again. UWM drew my eye yet again after the good run higher small caps have had recently (see chart).
I’ve been expecting a move back towards the trend lines of higher lows that are currently moving around $47-48. With that in my mind as a goal I enter a limit order on Monday afternoon to sell a couple of puts at the January 40 strike for $5.00. This was in between the wide bid and ask prices, but closer to the ask than the bid. I thought I might luck out and get someone random keying their order wrong or just impatient who would hit my limit. I planned to leave it in place for three days and then update it based on how the market shook out by the end of the week. Instead I saw small caps drop fairly hard this morning which pushed my target “ultra” index ETF more than half way to my ideal entry price for UWM. I saw the last trade for this contract was for $4.00, so I decided to drop the price for my limit order and see if I could get someone to jump in while UWM was slipping. I left for a lunch appointment, hopeful that I’d come back to an executed trade. No such luck with that, but UWM had fallen even lower by the time I got back. I thought I might have to drop my price down to $4.20 or even $4.00 by the end of the day to get it to hit. About an hour after that thought crossed my mind I heard the sweet sound of an execution ringing on my PC. While UWM was trading at $48.65 I sold two UWM January $40 naked puts for $4.50 and received $898.64 after commissions.
You can see in the chart I posted above that UWM is closing in on the lower half of its trading channel from the past couple of months. I have a scattering of other lines I’ve been watching over the months mixed in, so it’s not the cleanest chart I’ve ever posted. Another trend line shows potential support around $46 right now, but rising too. The 10 and 20 day moving averages (dma) both broke today which is pretty for the bears to see. The 50 dma is moving higher, right near two trend lines I expect to hold. Even the 200 dma (in orange) is on the rise to help with support before I take a loss. I circled the prices on the side of the chart to highlight where I’m at a full profit (in green), partial profit (in blue) and a loss (in red). The random other horizontal lines are different places I’ve identified as potential support in the next few months and on a couple the prices show because I have alerts set up there.
I went so far out of the money with this trade because I could still get an annualized return of 17.5% on this (assuming I actually had the cash to back it) and I can even get that with UWM taking a 17.78% loss. UWM would have to fall 27.02% for me to take a loss on this trade. It’s already down more than 6% from its recent high, so I don’t give a high probability to the chance of it falling that much more before January. Going back to the $40 price I need UWM to maintain for a full profit would take another 8% or so of losses in the Russell 2000 index. I know the small cap index is volatile, but that seems like more than we likely have in store for the long term.
We could get a fall that low and I could be assigned these shares and depending how my other positions go I could go on margin, but by the time the market drops that much I think I’ll be ready to buy more again at the discounted prices and write covered calls out of the money while I wait for a rebound. Of course I’ll deposit more by then and not everything will be assigned, so this comes back to a fairly low risk trade in my eyes. Also, three of my other UWM naked puts are for lower strikes which are even less likely to be assigned.

