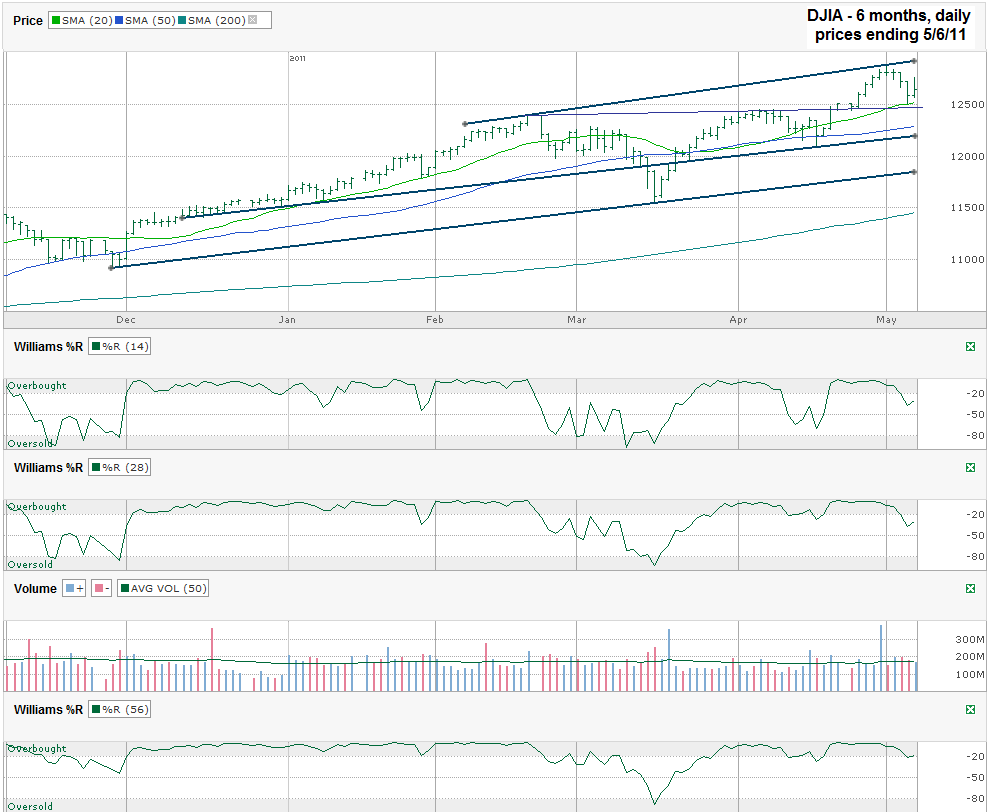
I charted daily prices for the past six months on the Dow Jones Industrial Average ($DJIA, $INDU, $DJI) after it closed on Friday, May 6, 2011 at 12,638.74.
The middle of the week felt like we were about to roll over and head much lower after disappointing data on Wednesday and Thursday, but then Friday came along and the April employment report shed the pessimists from the scene. The touch of the 20 day moving average (dma) on Thursday proved to be support for the week and could possibly lead to some more positive days ahead. The DJIA stayed in the upper half of its ascending trading channel with Friday’s slight bounce, but still doesn’t feel terribly secure in its footing there.
Following the trend line of higher highs the next area of resistance could be up in the 13,000 range. If employment continues to improve (although Thursday’s weekly jobs data didn’t seem to support that idea) and oil prices stay below $100 a barrel it’s going to be an easier path to get there. A reversal of either of both of those could give us a long overdue mini-correction. The 50 dma could be about all that’s needed to bring in more buyers again. That’s only around 350 below Friday’s closing level. Close by is another trend line of higher lows that could support that area. If those two hurdles don’t stop a decline we could head all the way back down below 12,000 again to the trend line of higher lows that has been in place for more than five months. I give this line a lot of credibility, but if it doesn’t hold I doubt the index would fall below its 200 dma just below 11,500 currently. Falling from the intraday high on May 2nd to 11,500 would be a decline of a tad over 11%. In this stage of the worldwide recovery, that seems like more than enough to shake out any fluff and beckon the value oriented buyers.
The Williams %R indicator still bears watching though. It fell below the overbought range which can be a signal that more declines are in store, but I only like to believe that when I see a confirmation day or two. So far we’ve had one confirmation day, but that one is even tainted since it showed the indicator pointing back up again. That’s hardly enough to get me sitting up straight at my keyboard ready to sell. Look back to late February and you can see how the Williams %R indicator fell then. So far it’s much different. I even included the 56 day period in today’s chart too. Going out longer removes the minor blips. It can make you late to sell if you only watch it, but (as in this instance) it can also show when waiting might be the better move for now.
I’m not saying I’m going out on a buying frenzy on Monday, but do see limited downside still and by the end of the year I expect the markets to be higher than we are right now. By no means do I think it’ll be a straight path higher. We will have some dips, but for now I don’t see why those won’t be bought after just a few percent decline.


I’m watching TBT closely for a potential trade. It’s been on a downward trend for the past 3 months but I expect an upturn as interest rate hikes become more likely (they’re already rising here in Europe). I’m considering selling some Naked Puts until assigned and, when assigned, sell ATM Covered Calls (and possibly further Naked Puts).
The Premiums are quite good – for example, if you held the stock today at $34.38 and sold a June 34 Call and a June 34 Put, you’d take in $2.64 Premium (or $1.49 for May).
12000 is posible. Things still doesn’t look good and remember this is May which is one of the bad months
My latest trade is RIMM. Sold June 40 Puts at $1 after commissions and June 50 Calls at $1 after commissions.
My thoughs are that I feel that RIMM represents good value here and I’d be happy going long at $38. However, I don’t see any near-term catalyst to pump it above $52 – the shorts will probably continue to play it for a few more points.
That leaves you a pretty good cushion on RIMM for both sides. Doesn’t seem to be a terrible risk there. your TBT play is interesting. $30 might offer good support there although $34 looks good for now too.
Yeah, I really like TBT here and $34 seems to be holding well. I haven’t yet traded on it. I got into one of your picks today – sold JPM June 43 Naked Puts at $1.15 after commissions. I can’t really see JPM dropping much below my potential $41.85 basis – although if the market as a whole declines we could see the high 30’s.
My Naked Calls on UNG look to be working out well and I’m hoping for a spike next week so that I can sell some June Calls (or possibly Bearish Call Spreads).
Also, just in case you weren’t aware, it appears that DSX have started their expansion with the purchase of another vessel (http://www.globenewswire.com/newsroom/news.html?d=221954)…. I’d been wondering when they’d be starting their expansion as the sector must be close to a bottom now.
As can be seen here http://www.dianashippinginc.com/default.asp?siteID=1&pageid=3&langid=1, they currently have 24 ships and two under construction. I’ve got really high hopes for the future growth of this company.
Ronan, Your comment was just caught by my spam filter. It catches comments with multiple links since those are frequently spam. You’re good now.
My DSX position is close to break even. I’ll add to it when assigned my 300 shares. I’m still with you on the belief that downside risk is probably limited from here ($11.25 on 5/17).