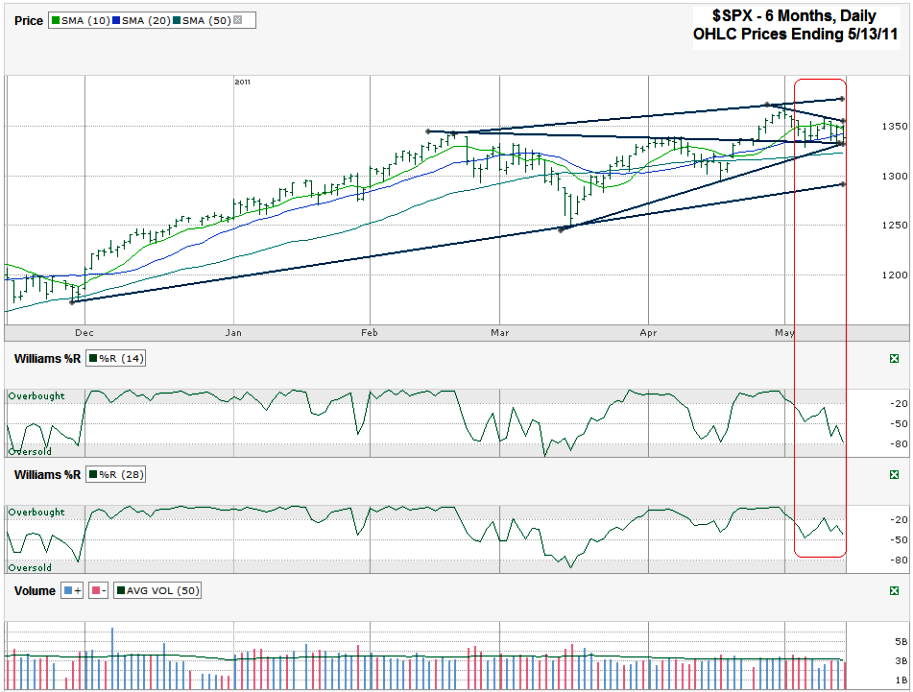
I charted the S&P 500 ($SPX) after it closed for the week on Friday, May 13, 2011 at 1,337.77.
I used four of the same trend lines from my last SPX chart two weeks ago. I replaced the longest trend line of higher highs with the shortest trend line of lower highs in this weekend’s chart. It’s interesting to me that the other four are still holding true. Most interesting is the longer descending line that’s in the middle. It shows what used to be resistance and now is acting as support for a trend line of lower lows. I identified this line two weeks ago as one to watch. Now this trend line of support has converged with another trend line of higher lows. We’ll know very soon which line wins the battle of lasting longer. The ascending trend line is at a fairly steep angle and might be too much for the markets to handle right now. With the mood of the market this past week, one has to wonder if we’ll be able to maintain such a slow descent for long as the longer trend line of lower lows indicates.
These trend lines mentioned above are just short term guidelines compared to the more distinct trading channel between the longer trend line that started in December and hasn’t been broken to the downside yet. It’s closing in on 1,300. The upper trend line of higher highs started in May and is a little over 1,375 right now. That’s a reasonable area for the index to maneuver through as it works out some doubts in the fundamentals. Within this trading channel the 10, 20 and 50 day moving averages (dma) are jockeying for position.
The 50 dma is still cruising along uncontested. The 10 and 20 dma are solidly in the mix though. On Friday the SPX’s range spanned from above both to below both. I’ve mentioned a few times in the past that I look at the crossover of the 10 dma below the 20 dma as a bearish signal. When it happened in late April the indicator didn’t hold true. (Not everything works every time, good lesson). If the SPX doesn’t shoot back up quickly we’re headed for another crossover this week and I’d be surprised if the usual pattern didn’t surface this time and open the door for lower levels soon. Along with the trend lines that might disagree with that, the 50 dma will probably put up a speed bump too. The 50 dma has broken a couple of times since March started, but not for long. I could see that happen again with the longest trend line of higher lows holding support yet again. A retreat down to this line would be a min-correction of about 5%. That seems like a great area to buy the dip again.
The Williams % R indicator supports the view that we’re in for lower moves coming still. It started retreating below the overbought line the day after my last SPX post when I said it hadn’t broken yet, but to keep watching it. Now it’s down and still declining. Volume this past week remained lackluster during most of the sideways movement which doesn’t help us much. As I’ve said most of this year, I think we could see another few percentage point drop from here, but the bull market is still in place and the risk to the downside seems limited.

