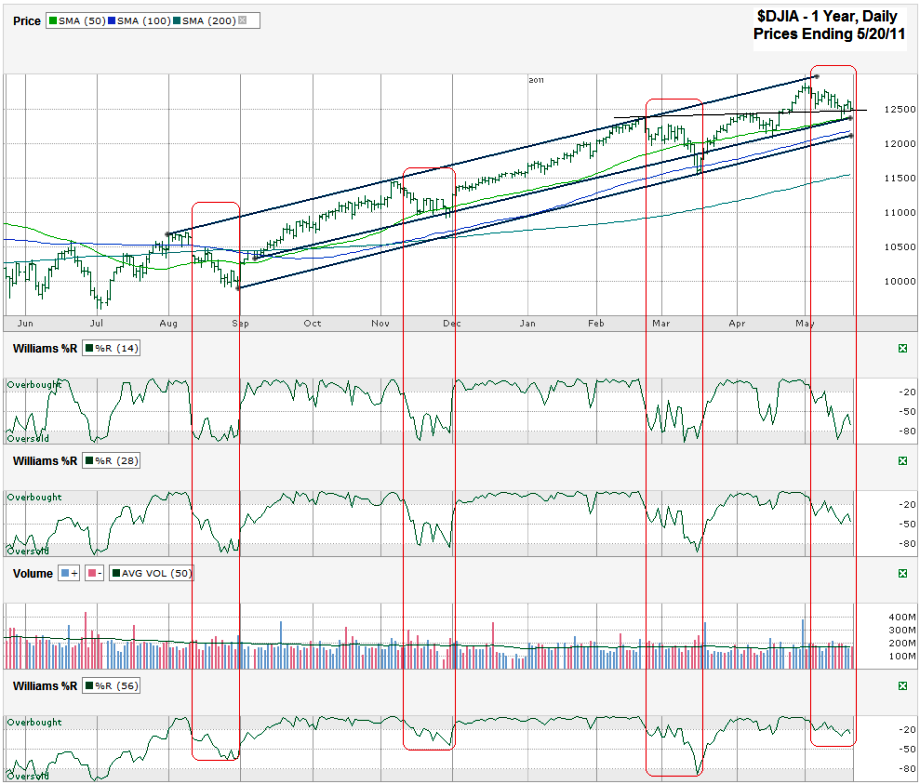
I charted daily prices for the past six months on the Dow Jones Industrial Average ($DJIA, $INDU, $DJI) after it closed on Friday, May 20, 2011 at 12,512.04.
The decline over the past three weeks has felt more severe to some of us than it really has been. We’ve only seen the DJIA drop 2.8% from its intraday high on May 2nd to the close on Friday. That’s not really much yet after such a strong run higher since the low in August 2010. I didn’t show it in the chart below, but the 10 day moving average (dma) had a bearish crossover with the 20 dma mid-week. Although this crossover didn’t pan out to be negative for the markets the last time it happened, the tendency for it to foretell darker days ahead seems to be accurate this time around. I left it off this chart because the 50, 100 and 200 dma all are worth paying more attention to right now.
So far the 50 dma has stood its ground and maintained support. It has a trend line of higher lows that it is following for the month to date. Both of those together could be enough to keep any deeper correction from occurring. I also included a thin black line that shows previous resistance and now possible support. It’s running close to the other ascending lines I just mentioned. All three of these have broken at least once in the past few months, but only briefly for each one. None is invincible and all are worth watching.
The Williams %R indicator is making the argument against support at the current levels and is pointing to lower days ahead. The 14 and 28 day periods that I usually include in my charts started to show the impending decline a couple of weeks ago. This week I included the 56 day period too. As the longer periods in any indicator remove some of the short term “noise”, the 56 day period for the %R doesn’t break as often. It’s starting to break below overbought now though. I highlighted the past three times it has done this along with the current range. In each of the other three times over the past year we saw more downside to the markets after such a break. One of these slides was somewhat shallow, one was around 500 points and the most recent was closer to 750 points. In any case it bears watching.
Using the 500+- point average could drop the DJIA down to its 100 dma. The 100 dma could be enough on its own as it was in March, but couple that with a typical %R break average and a 5% drop in the markets and we see a good excuse for buyers to re-enter the market again. If 5% isn’t enough to hold us up again we could see the index fall all the way back to its 200 dma. A fall that low would be about 1,325-1,300 points for the DJIA from its recent intraday high and would give us the first 10% correction of this bull market. We’re overdue for a good one like that, but it doesn’t mean this is the time for it to happen. If it does, I fully expect strong support to surface around then.
Volume doesn’t tell us a good story lately – not good for the bulls or bears. Volume has picked up, but on both positive and negative days and this week we just ended was an options expiration week so it could be taken with a grain of salt. I see more potential downside for the index, but not enough to sell everything and go into hiding any time soon.

