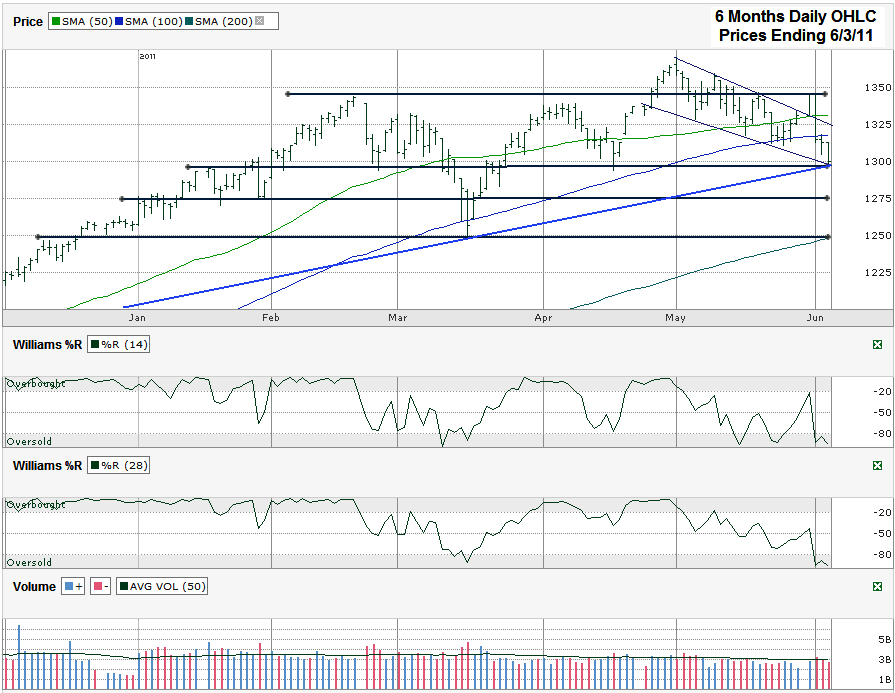
I charted the S&P 500 index ($SPX) after it finished the week at 1,300.16 on Friday, June 3, 2011, just above the key psychological round 1,300 mark. This week marks the end of the first five week losing streak since July 2008 for the index. Back then it fell almost nine percent in the same span. This time we’re only down less than five percent. The decline probably feels like it’s been worse than it has because our current bull market has had so few mini-corrections. I would even call another five percent lower still healthy and by that point I expect support to surface and that’s if we even get any lower that Friday’s lows.
As opposed to a couple of weeks ago when the moving averages gave us insight into where the markets were heading, this week it seems to be more about the trend lines. I filled this chart with four horizontal lines that mark various levels of the broad trading channels we’ve seen for the past six months. I also included three other trend lines I’ll cover. The SPX finished the week at the bottom of its main trading channel of the past four months. This puts it at a major area of potential support for the near term. If the index behaves like it has for most of this year it should start attracting buyers again very soon and could move back up another 3-4% until it nears the uppers side of this major trading channel. Upside beyond the 1,350 area still looks iffy for now.
If line just below 1,300 doesn’t hold I expect another 20-25 points to the downside. This could only be a speed bump all the way down to 1,250 though. From there I expect strong support to surface quickly. This same area held support earlier and that alone can be enough of a reason to see the selling stop, but also we find the 200 day moving average (dma) moving up to the 1,250 line. The 200 dma often is the line to really watch for longer trends. Staying above it means the bull market should continue. This area is also around a 9% correction from the intraday high reached at the end of April. Those three points together should be enough to keep this market going after a healthy shake-out. Any upside move from Friday’s close is going to have to climb past the 50 and 100 dma. Each could act as a hurdle on the move back towards 1,350 just as they both stalled the descent briefly toward 1,300.
The blue line marks the trend line of higher lows that started in September 2010 and hasn’t been broken yet. On Friday we saw support surface there which just happens to be along the same line as the bottom of the trading channel I mentioned above and the shorter trend line of lower lows. These three lines converged to hold support and next week we’ll see which line wins, the longer running blue line or the shorter thin line of lower lows. Chances are greater for the longer term line to have greater staying power, but it could be short lived as the short thin trend line of lower highs comes back into play. This one month descending trading channel is only good for short term speculation in my view. It’s too steep to last another full month.
Keep an eye on the Williams %R indicator to get an early indication of when any positive day can turn into a new rally. We saw both the 14 and 28 day indicators fall below the overbought area at the beginning of May signaling a time to take profits. Now that the S&P 500 is down in the oversold area of this indicator we have to wait for it to move above the shaded area and preferably have two to three confirmation days before we jump back in too strongly. Ideally we’ll see a pick-up in volume from the past two plus months of below average volume when the move to the upside begins. Strong volume on a surge higher could mean a much longer next step up in the rally is here. The same to the downside could happen too, but after a month of bad data that hasn’t happened yet.
From Friday’s close the S&P 500 appears to be situated with about 4% more downside potential and 4% more upside potential. With such an even risk/reward it seems wise to use more of a wait and see approach for the next few days and see which side gains momentum. If we do see another 3-4% move to the downside the risk/reward will shift strongly in favor of adding risk again and allocating some reserves back into stocks.

