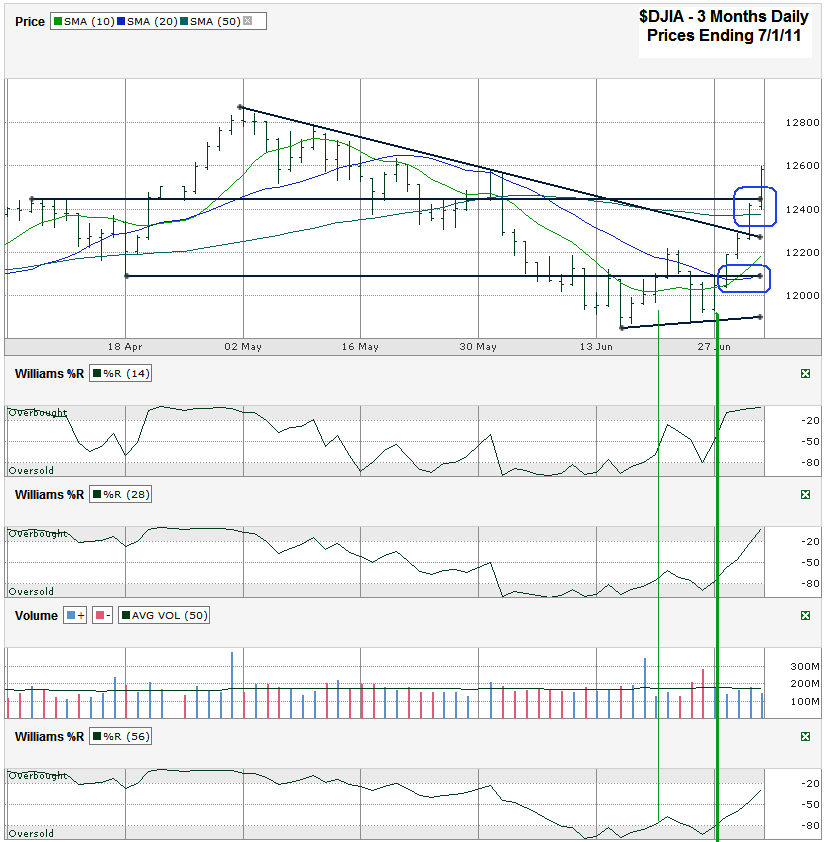
I charted daily prices for the past three months on the Dow Jones Industrial Average ($DJIA, $INDU, $DJI) after it closed on Friday, July 1, 2011 at 12,582.77. This past week was huge for the Dow. Not only did it pull out a weekly return of more than 5%, it brought out a handful green lights from various technical indicators. The first came from Williams %R. Actually you can see the thin green line that shows the initial heads up that better days were ahead. I always suggest waiting for a couple of confirmation days after the break above the oversold area. If you waited you would’ve had an opportunity to buy back in closer to the lows again. (Just lucky this time.) The final (thicker green line) came this week and that’s when the non-stop rally started. Soon after that we saw the 10 day moving average (dma) cross over the 20 dma for one of my favorite bullish indicators. You could see this crossover coming days in advance, but when it hit is when it looked like someone poured gas on the bull’s fire.
The bounce from the 10/20 crossover gave the rally enough momentum to break above the trend line of lower highs that has been acting as resistance since it started at the beginning of May. Just a couple of days later the 50 dma broke intraday and the following day we saw a confirmation day of this break to let us know it wasn’t a fluke. I threw in one final horizontal line that was previous resistance and support to show another mild bullish signal.
Volume was below average most of the week which made the run higher easier, but with this much of a rally in this few number of days it’s not something you want to miss out on. This coming week should be a light volume week again due to the holiday on Monday. Then earnings start and volume and a more trustworthy direction should be established soon.
Have a safe and happy Fourth of July to all of my readers in the USA!


