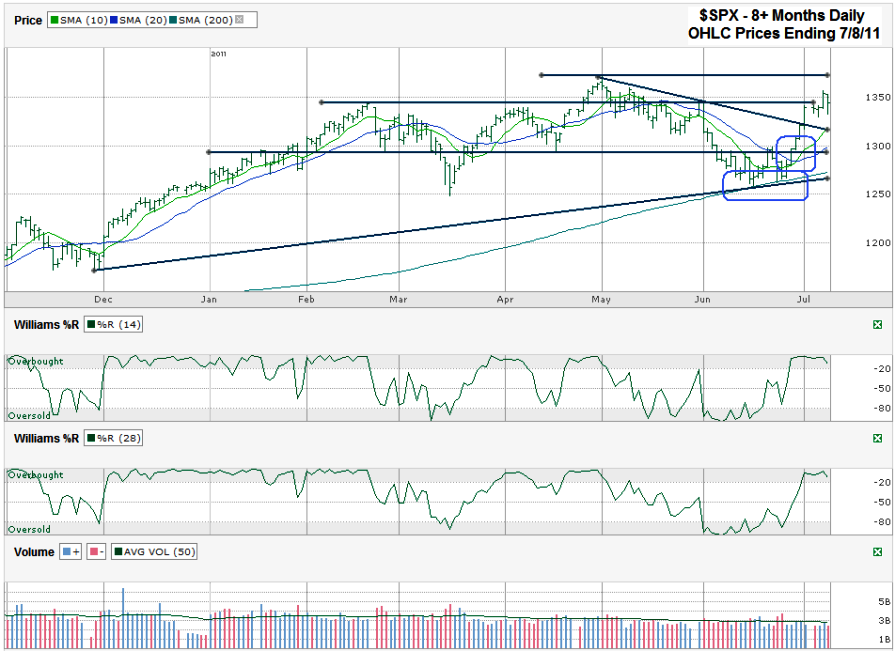
I charted a little more than the past eight months of the S&P 500’s ($SPX) daily prices after it finished the week at 1,343.80 on Friday, July 8, 2011. After ripping higher from the floor set by the rising 200 day moving average (dma) the SPX looked like it was going to be on a run to new highs without taking much of a break – and then the jobs data had to rain on that parade. While the crack in the lagging indicator gave investors a scare, from a technical view Friday wasn’t such a bad day. Fear took the large cap index down nearly 20 points in the morning and then the dust started to settle. Before the end of the day the losses were halved, finishing at the highs of the day. Such a quick recovery after surprisingly bad data bodes well for the bulls.
This failure to collapse easily might not be such a surprise for technical analysts. First the 200 dma held support and then the SPX crossed 1,300 yet again with barely a pause and subsequently had the very bullish 10 dma crossover above the 20 dma. If that wasn’t enough, the short two month trend line of lower highs that defined this mini-correction’s top broke resistance after only one day of holding the market back. The rally was due for a breather by the time this past week rolled around, especially with the July 4th holiday thrown in at the beginning. Volume was low and the market was left to drift sideways.
Based on all of that it’s easy to expect the rally to pick up where it left off before the holiday shortened week, but there’s a caveat. With such a quick rally at the end of June the SPX has moved back near the top of its trading channel, just under 27 points from its multi-year intraday high. This intraday high of 1,320.58 hit on May 2nd is the next key line to watch for major resistance. A move above 1,321, with a couple of confirmation days following the break, could spell much more upside potential that could last through the end of the year. Downside support still appears to be moving higher along with the 200 dma and the new trend line of higher lows that started in November 2010 and was touched last month. Putting all of that together shows more downside risk than upside potential in the very near term, but once resistance breaks at 1,321 we could be off to the races again.
Investors should keep an eye on the Williams $R indicator to get an early warning of a bigger collapse. It broke higher in mid-June as yet another indicator screaming to buy at the right time. It’s going to be one of the first technical indicators that lets us know when to head for the exits again. Just because it is in the “oversold” range already doesn’t mean the time to sell is here. Wait for %R to fall below the -20 range on both the 14 and 28 day periods to have a clearer signal. This will be after the first few points are lost, but will keep investors from jumping ship too early just because the seas are getting rocky again.
With this bull market around 28 months of age it might be too early to think the fun could be over already. The average bull market is over 38 months. Another 10 months of higher stock prices could move the SPX back to being well above its 200 dma and then it might be a better time to be longer term bearish. For now, the rest of the year doesn’t look like we’re headed for a major sell off. Keep an eye on the technical indicators for any change to that view.

