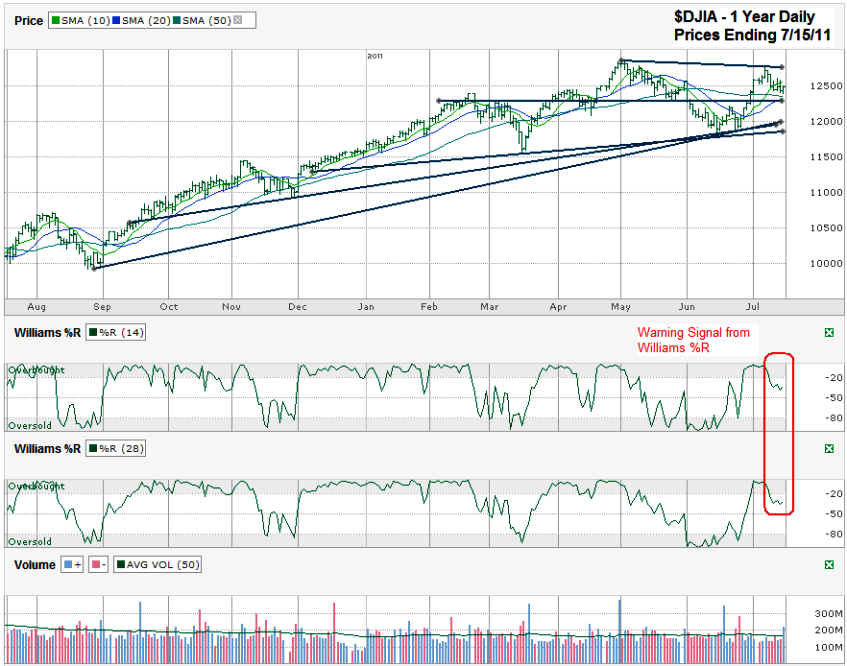
I charted daily prices for the past year on the Dow Jones Industrial Average ($DJIA, $INDU, $DJI) after it closed on Friday, July 15, 2011 at 12,479.73. The DJIA came close to its multi-year high a little over a week ago, but failed to get all of the way up there. This creates the second point of the new trend line of lower highs and will be worth watching in the weeks to come as resistance on any new rally. Soon after this fast, but short-lived rally ended (or paused for all we know so far) the index fell back below its 10 day moving average (dma) and then found support at its 50 dma soon enough to stop the descent from building into anything major. The 20 dma is rising quickly and is approaching a 20/50 bullish crossover soon if the Dow can hold level or better for another week.
Friday left the Dow sitting about mid-way between the top and bottom of its trading channel which means the chance for a move up or down a few percentage points is close to equal right now. The advantage might sway to the bulls though when a longer look is given. First the 20 and 50 dma are still holding support as I mentioned above, but then the trend lines show a lot of potential areas of support. This protection from another major sell off could be what it takes to keep the longer term bull market intact. I drew three trend lines of higher lows, all starting at different points, but all using the same intraday low from mid-June. Each of these lines can be good areas of support if the market’s weakness continues much longer.
According to the Williams %R indicator, weakness should continue. %R broke last week and has had four consecutive confirmation days since then. That’s hard to ignore in a technical indicator that is so often correct in predicting further weakness (and further strength when moving the other direction). A move down towards the 12,000 area looks quite possible if the 20 and 50 dma do not hold support. That might be far enough for the %R indicator to predict and is also close to where the 200 dma (not shown) is currently.
The timing of this little descent followed by strong support could play in exactly with the timing of talks on the US debt ceiling. The deadline is still two weeks away. 500 points lower seems like it could be perfectly timed for the beginning of August when we reach a resolution “just in time” to avert a national disaster. As the markets tend to do, this fall might be timed to perfection, much as the peloton catches breakaways in the final 5 km of stages each day in Le Tour de France.

