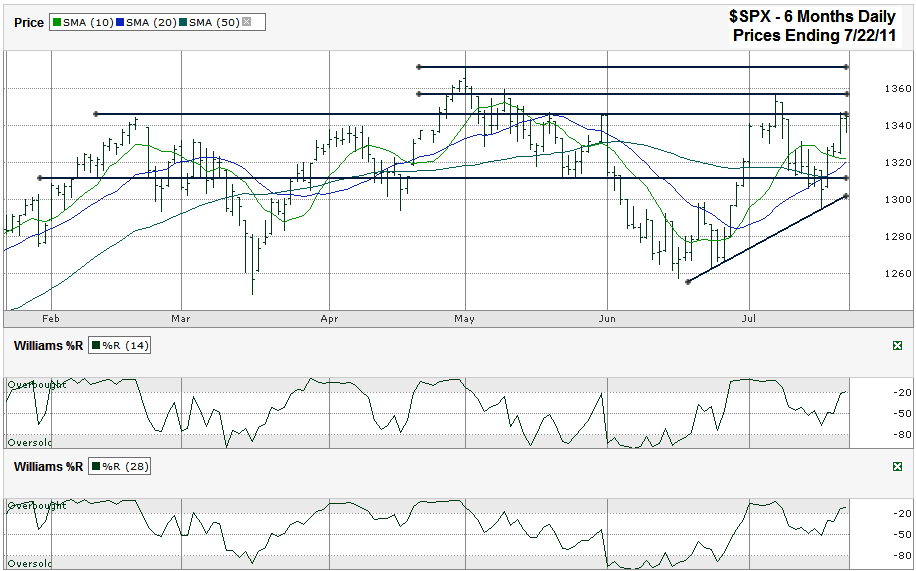
I charted a little more than the past six months of the S&P 500’s ($SPX) daily prices after it finished the week at 1,345.02 on Friday, July 22, 2011. After falling to its lowest levels of July, the large cap index rallied 2.2% this past week which brought it up to a 6.9% return for the year. This run higher also pushed the SPX back into the upper range of its trading channel. I drew four horizontal lines that highlight possible hurdles on the SPX’s way up and down. Starting from the bottom is light support. It has broken often, but shows the bottom of the range for where the S&P 500 has spent most of the past six months. The next line higher shows the higher range of this same six month channel. That’s also where it stopped on Thursday and Friday with resistance proving tough for now. The next two lines higher show the intraday high for July and the intraday high for the year. Both of these are going to be key points to watch to see if the bulls have enough conviction to push through this time.
Before this past week’s lurch higher the 10 and 20 day moving averages (dma) were on a collision course to converge and then have a bearish crossover. They still appear to be on the verge of crossing over, but now that the index has rising back above the 10 dma again the crossover will be short lived and maybe barely noticeable. Keep an eye on this though. The 10/20 crossover serves as a strong indicator usually. Sometimes (like last time) it’s the second quick crossover that gets the markets to rollover. On a positive note for the moving averages, the 20 dma also moved above the 50 dma at the beginning of the week and the bullish crossover dished out a positive follow through per its typical tradition.
The fifth trend line I drew was the only angled line. It marks the trend line of higher lows that started in June. While this line is currently around 1,300, it is moving higher quickly and could come back into play fairly soon (one to two weeks). Watch it for support. If it breaks we’ll probably see the 10/20 bearish crossover again and should expect another reversal lower. For now, this trend line is not in play. It’s just worth watching as it stretches higher. The Williams %R indicator has returned to the overbought range by a hair. It’s not quite in entrenched enough in this area yet to expect a move lower into the middle area to be noteworthy. If next week keeps %R moving higher then it will become more relevant again.

