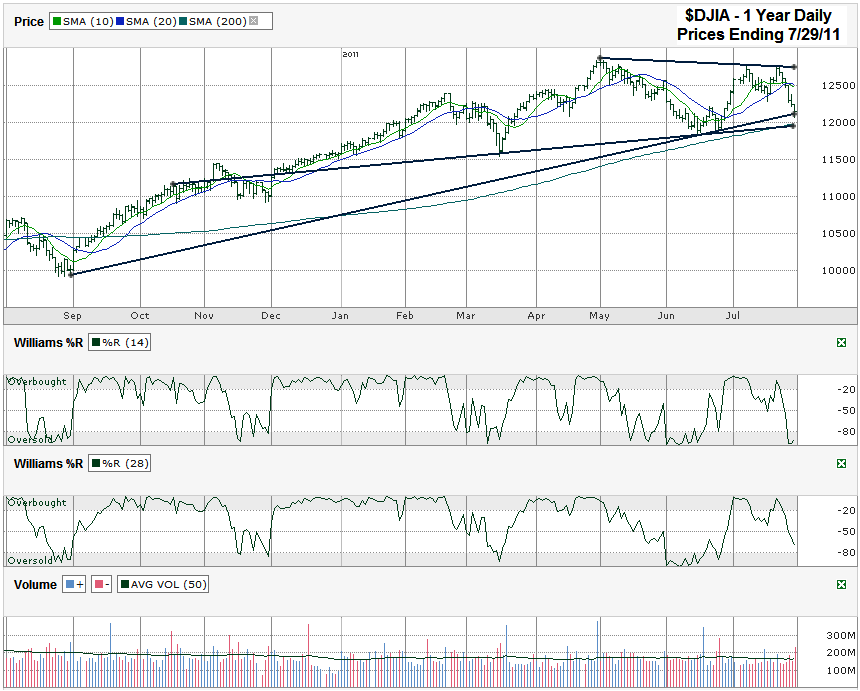
I charted daily prices for the past year on the Dow Jones Industrial Average ($DJIA, $INDU, $DJI) after it closed on Friday, July 29, 2011 at 12,143.24. When I posted a DJIA chart two weeks ago I pointed out that we would probably see the index come down to its 200 day moving average and the spot of its longer trend lines at about the same time the August 2nd deadline was upon us. Low and behold this is the final weekend before that day is here and the Dow gave in big this week to get down to these levels I predicted. The trick from here is seeing if support holds while (assuming) Congress and the President work out the final details on a deal.
The chart for the last week of the last year showed a full roll over. The 20 day moving average (dma) rose above the 10 dma. Williams %R cracked and fell below overbought for both the 14 and 28 day periods. Volume rose as the slide picked up pace. It all foreshadowed a much bigger decline was still on the way, but support held before the index reached the 200 dma. Support at the longest trend line of higher lows was the key stopping point for the slide. The next strong trend line was set to offer another strong stand of support less than 100 points later. This next line might not even come into play if the rumors of a deal on the debt ceiling become reality by tomorrow.
A deal among the Powers That Be could cause the rest of the technical indicators to be thrown out of the window as the barrier to higher prices and more risk is removed (at least temporarily). The run higher could cover a quick 550 (or more) points before the first area of resistance comes back into play. The first line to watch will be the declining trend line of lower highs, still above 12,700. If that declining trend line doesn’t stop another rally we could see a return to a longer trend line of higher highs that I didn’t even bother to include in this chart. There’s always trouble in the European Union to think about once we get to the top end of this range, so we can reassess once we’re back up there.

