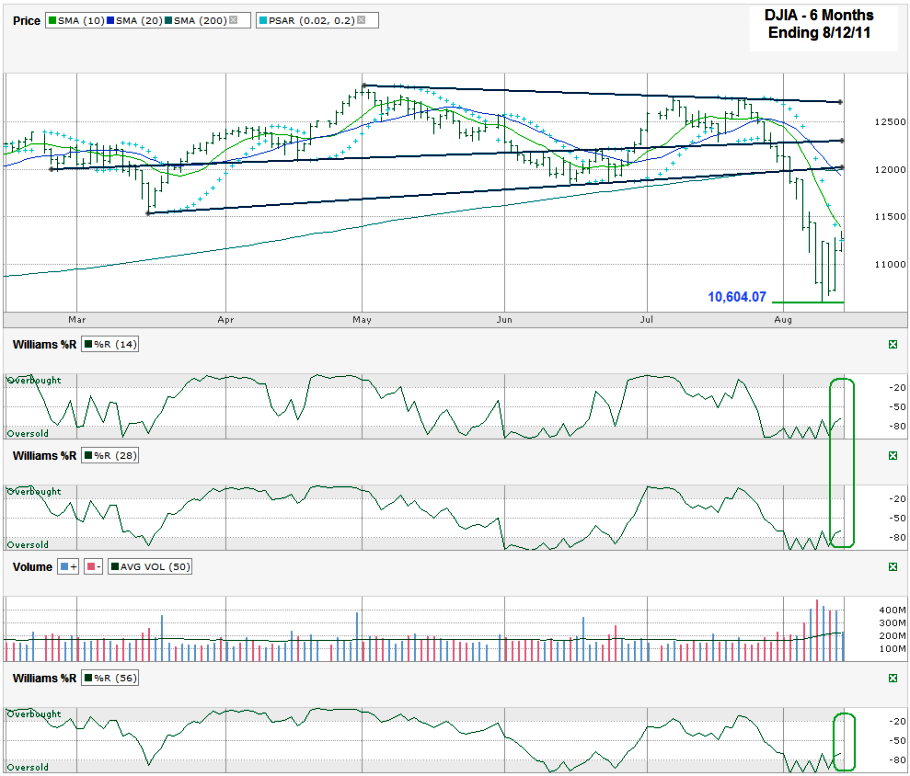
I charted daily prices for the past six months on the Dow Jones Industrial Average ($DJIA, $INDU, $DJI) after it closed on Friday, August 12, 2011 at 11,269.02. Two weeks ago when I last posted a DJIA chart I questioned if we were at support. I did this in the face of the majority of the technical indicators I listed saying more declines were still in store for the index. The mistake was trying to rationalize what I didn’t think was right due to the timing with the debt ceiling talks. The point of charting is to avoid any rationalization and just listen to what the charts say in a vacuum. Although I listed the bearish indicators I gave more hope than I should’ve to the bulls. Lesson learned (again), moving on.
By Friday at least one indicator was turning. Williams %R has made the first move higher in what could be the beginning signs of a bottoming and a fantastic buying opportunity. The signal isn’t green yet, but could be by Tuesday. Williams %R has moved above the -80 oversold area that indicates a positive momentum shift, but has only done if for two days in the 14, 28 and 56 day periods I watch. The first day (Thursday) was almost right on the -80 line, but I’m giving it to the bulls by a very slight margin. Friday was solidly higher. I prefer to see two confirmation days after the initial break above oversold before I turn bullish and that should be on Monday or Tuesday at the latest. Because of the borderline first day move I’ll probably wait until Tuesday morning to get truly bullish again.
I might be more anxious to turn bullish if the 10 and 20 day moving averages (dma) were any closer to having a bullish crossover. For now they are stretched to their maximum distance we’ve seen in many months. The all clear signal won’t be given (as if it ever really is) until the 10 dma moves above the 20 dma. This week is the first time I’ve included the Parabolic SAR (PSAR) indicator. I’m going to give it a try to see how it works for me, but in back testing it appears to be a fantastic indicator, much like Williams %R. A bullish stop and reverse signal looks to be imminent from it at the start of the week, but I want to see it first and might want to see a second day of action before I give it more than a benefit of doubt. (Feel free to educate me on the use of PSAR since I’m new to it.)
I left some trend lines in the chart below to show potential resistance to any rally. The two lower lines were previous support. Support often becomes resistance after these lines break, so they are worth watching. The top line is this year’s trend line of lower highs. It has a high probability of acting as resistance again, so definitely watch this one. The lowest trend line that could act as resistance is very close to being in line with the 200 dma. Just as the 200 dma has been support so often, it can just as easily be resistance. A move back up to this line would be close to a 6% gain from Friday’s levels. That’s not a shabby gain and probably a good place to see the DJIA take an opportunity to regroup.
The downside might be limited to another test of the 10,604 area that marked the intraday low on Tuesday, August 9th. Again, there is no reason to rush in quite yet if we dip down there. A show of positive support there should bring out the bulls though, so be ready to jump on some bullish trades.

