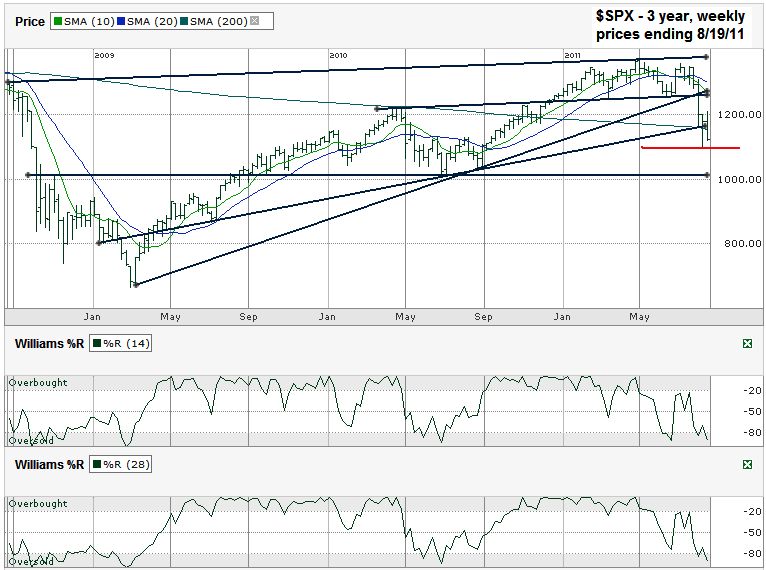
This S&P 500 ($SPX) chart shows the past three years of weekly prices after the index finished the week at 1,123.53 on Friday, August 19, 2011. You know you are charting am ugly market when you have to stretch the chart to three years to look for clues to the next area of support. SPX is trading below all of its moving averages, so they give no help for where the next area of support may be. All of the ascending trend lines have already been broken, so they don’t help either.
The next real key test for the large cap index is if it will hold support at the low from earlier in the month. If this intraday low of 1,101.54 doesn’t hold the next stop might be closer to 1,000. That gives about 2% of easy downside risk before expected support should surface. If this line (in red below) doesn’t hold it could mean another 10% lower from current levels. A fall below that is very unlikely based on valuation and the fact that this fall would be close to the average bear market decline. Before the bears take the index that low I’ll buy some inverse index ETFs to try to profit from the trip lower. I won’t be buying those ETFs until I see 1,101 break though. I thought about trying to buy one or two of these inverse funds to catch the next 2% lower, but don’t see much benefit for the risk of a snap higher.
The Williams %R indicator doesn’t give much help in predicting support either. Markets can stay oversold for months. Williams %R is just continuing to confirm its sell signal from mid-July. Once the market bottoms, this indicator will turn higher. It won’t catch the bottom, but will let us get in for most of the ride higher.


