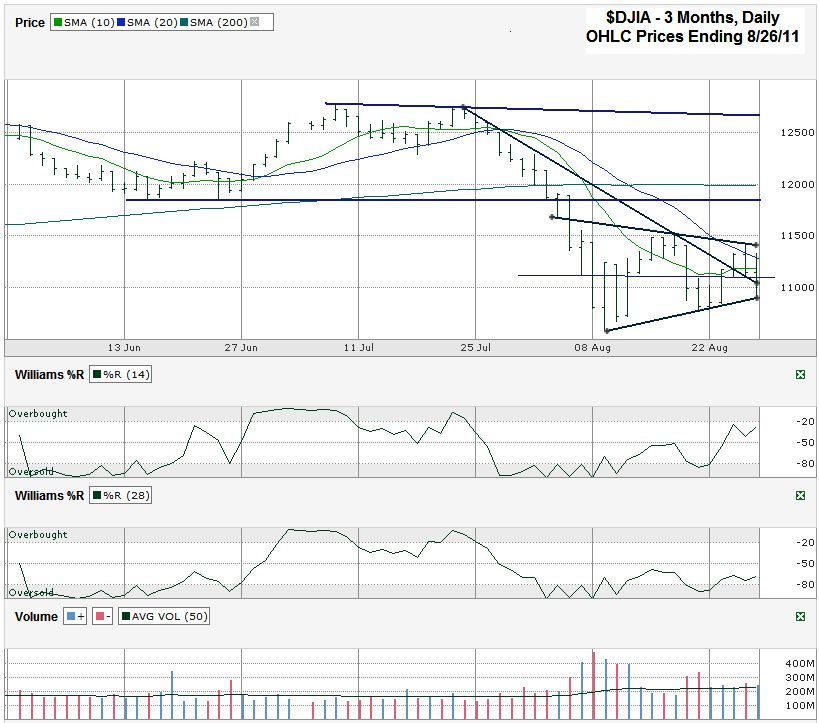
I charted daily prices for the past three months on the Dow Jones Industrial Average ($DJIA, $INDU, $DJI) after it closed on Friday, August 26, 2011 at 11,284.54. I kept the chart’s range a little tighter than usual this weekend to emphasize the past few weeks’ daily movement more than anything else. Over the past 16 trading days a base started to form. The battle between the bulls and bears has raged in a 500 point range mostly with only a few outlying pieces. The intraday low from August 9th of 10,604.07 is starting to look like it could be this correction’s low. We saw the Dow try to retest it on the 19th, 22nd and 23rd, but it fell short (or rather didn’t go low enough) on either of these days. Instead those three days all ended with intraday lows close to each other, but slightly improving each day. This showed a reluctance of the bears to push any harder to the downside in fear of a major short covering rally that might catch them off guard. Instead each push lower ended shy of the previous day’s low. After three days of trying the bulls took the reigns and had they chance in the sun and finally pushed north of the 20 day moving average (dma) for the first time in weeks. They couldn’t keep the index above the 20 dma until close and that helped influence the next day’s start lower. Hope for the bulls returned on Friday. The DJIA closed almost directly on its 20 dma and once again above its 10 dma.
The short term trend lines of higher lows and lower highs are on a slow path to converge. This shows volatility decreasing and supports the based building theory. The longer descending trend line of lower highs that started in late July finally broke last week. This illustrates the worst of the steep decline could be over, although the DJIA could follow this line lower as a trend line of lower lows. That doesn’t seem as likely based on the Williams %R indicator. The second week of August showed a “head fake” in Williams %R as it cleared the oversold area and had multiple confirmation days which I always like, but the ascent wasn’t steep enough to get us to fall for it. This past week looks different though. %R on the 14 day indicator has moved higher sharply and had three confirmation days to follow. The 28 day indicator can’t seem to agree with it though. It’s higher, but not with such vigor yet. It might need the 10/20 dma bullish crossover to make it shoot higher.
The chart shows a clear attempt by the Dow to push higher, but its legs are still wobbly. It might be a time to test the waters with some smaller positions and be ready to jump in deeper when the shorter trend line of lower highs breaks (around 11,400) or dump what you have left in a mad dash for the exits if the August 9th low breaks. For the lower end, we’ll have a good warning signal if the lower trend line of higher lows breaks (around 10,930). Stay nimble and ready to react. The fun isn’t over yet.


