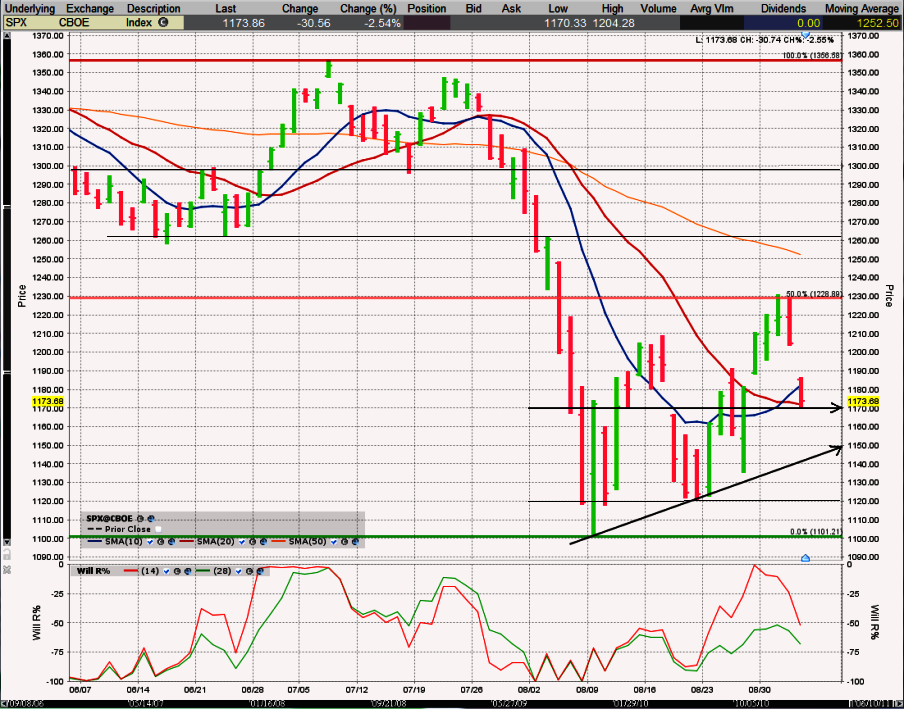
This S&P 500 ($SPX) chart shows the past three months of daily prices after the index finished the week at 1,173.97 on Friday, September 2, 2011.
The large cap index had a great run off of its August lows, but faced resistance at the 50% retracement line from the July high to the August low. In other words, the SPX halved its losses from its highs. The key technical level was too much for the rally to handle as traders were more inclined to sell on any questionable resistance. The index made two attempts at breaking through 1,230 and then rolled over after not being able to close within 10 points of the line on either attempt.
This rollover came just two days after the very bullish indicator of the 10 day moving average (dma) pulling above the 20 dma. This simple moving average crossover foreshadows most major market moves, but is not flawless – especially in markets such as the current one that turn on a dime with every hope and fear. Many traders saw the most recent rally as a selling opportunity from the day it began. The question was only when to sell. The 50% retracement line proved to be an easy exit point as it often is.
After gapping down to start the day on Friday, bulls had to wait patiently to see if the next key area of support held. Technicians tagged 1,170 as the area that was do or die for support – and it held, for now. The SPX managed to bounce off of its intraday low slightly and closed just above its 20 day moving average. These two lines are crucial to watch. Bulls want to see the index move back above is 10 dma and resume its rally. Bears want to see a close below the 20 dma and the 1,170 demarcation line. If the bears can break support at 1,170 the next area of support that is likely to give support is the trend line of higher lows, currently close to 1,150 and ascending quickly. A dip to the 1,150 area is only 2% below Friday’s close, but if it gives way then the next two stops might not be until 1,120 (4.5% lower) and 1,101 (6% lower).
If support holds at any of these levels, bulls will have to face resistance at the 1,230 line again (almost 5% higher) on any rally. Above that, resistance might not be seen again until 1,260 (7.4% higher) and then 1,300 (nearly 11% higher). The 50 dma is in the middle of these lines, at 1,250 and falling. It might not act like much more than a one or two day speed bump on any move higher. The big gaps in resistance levels should be filled quickly as shorts have to cover their bearish bets as fast as possible. A run back up to 2011 highs near 1,360 is just a dream for bulls right now and can be debated once 1,300 is more than a hazy object in the distance.
The Willliams %R indicators for 14 and 28 day periods have given two false starts to the rally. This is extremely rare and adds to the pessimism the bulls have for this new collapse in stock prices. Probability shows that any move back into the oversold area of Williams %R (below -80) should be short lived and the next move out of this region could last much longer.


It’s a tough one to read but there’s a lot of good Premiums out there if you go the individual stock route as opposed to indices.
One I went for today is CAT. It’s extremely difficult to know where this will go in the near term but I like both it and DE in the long term. I sold one CAT Oct 72.50 Naked Put at $2.41 – the $0.01 covers my commission 🙂
The trade gives me a basis of $70.10 if assigned – which is just $0.10 above the 52 week low and a little over 16% below the current price.
That looks like a good trade. I’m still expecting the August lows to hold. That’s why I haven’t sold covered calls for the most part. If Monday, 9/12, doesn’t give us a bounce from today’s lows I’ll be surprised.
I almost added more UCO naked puts today, but fear the dollar’s strength might work against me. Check out CSX. It fell beneath its trend line of lower lows today, but I think it’ll run back up towards $21 before long and eventually higher.
I haven’t looked at CSX in a while. I hadn’t realized it had gone so low and it’s in an industry I’d like to get into. I’ll be keeping a close eye on that. Thanks for the heads up.
Regarding UCO, I agree that oil should be near a floor but I’m currently long BP via a long Call/short Put Calendar Spread and, if oil rises, that position should rise in value – so I’m just watching UCO/USO for now.
Thinking of getting into T through naked put…the premium and dividends r enticing.
@Khan: A dividend is due at the start of October and, as you’ll not be entitled to this as a Naked Put seller, make sure to factor it into your calculations (you probably already know this anyway)
That’s me into a half position on CSX (thanks for the tip). Sold 2 CSX October 17.50 Puts at $0.66 each giving me a basis of $16.85 if assigned. It’s a 6 week trade with a 3.86% return (33% annualised). Like you, I don’t see it ever reaching these levels but, if it does, I’ll be happy to double down.
@Khan, I think T will turn back higher before long. Too bad I already opened a full position. I’d like to get more at this reduced price. My puts are still sitting at a paper profit, if they expired today. I won’t mind taking an assignment and taking that fat 6.25% dividend while I sell OTM covered calls on it.
@Ronan, That’s a good trade I think. I wouldn’t mind owning more at that price too. I’ll have to consider adding to my position. I hope it works for you, especially since I own it at a higher price. 😀