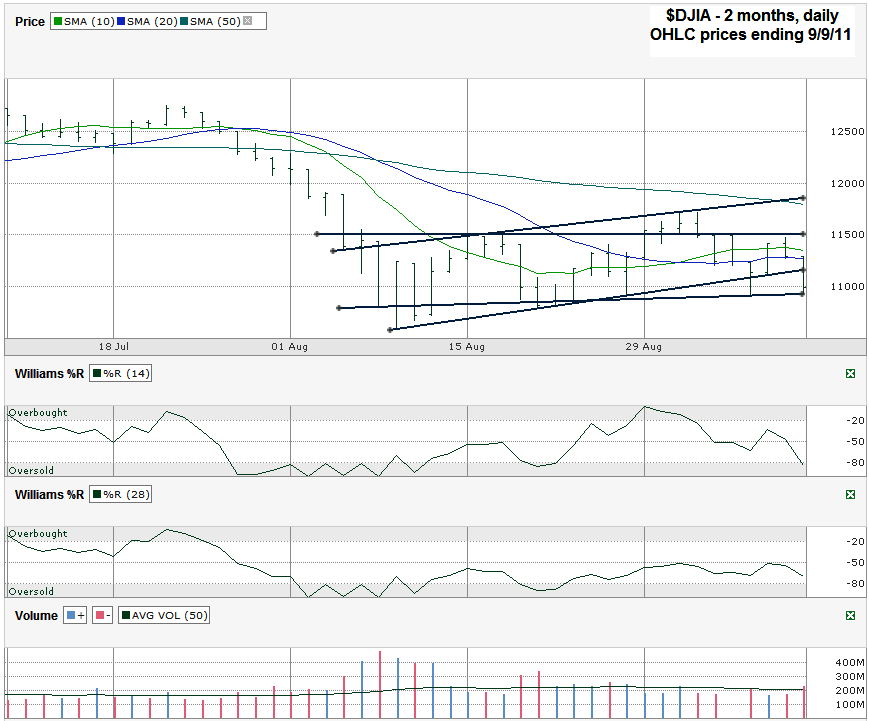
I charted daily prices for the past two months on the Dow Jones Industrial Average ($DJIA, $INDU, $DJI) after it closed on Friday, September 9, 2011 at 10,992.13. There’s really no need in looking at a chart that goes back any further for now. All of the price action and trends that matter are caught in the past two months and mostly since the beginning of August. I’ve identified two trading channels below. One is slightly ascending and the other is almost completely horizontal. The ascending trading channel broke to the downside this week and its trend line of higher lows isn’t really valid any longer, but I wanted to show how it was working. On Tuesday (first day of the week after Labor Day) this ascending trend line broke and then on Wednesday came back into play after the DJIA opened right on the line. When the top end of the horizontal trend line offered resistance the index plummeted through the ascending trend line again until it found support at the horizontal trend line of every so slightly ascending higher lows. If this trend line breaks, the next areas of support could be almost 200 points lower at 10,800 or even another 200 points lower, close to the August lows, around 10,600. Below that bigger gaps open up. Any move higher could face short term resistance at the ascending trend line that failed twice this past week.
The moving averages aren’t helping us a lot right now. The move higher of the 10 day moving average (dma) over the 20 dma usually signifies a confirmation of a trend higher, but two of the past four days have closed below both of these averages which skews this prophecy greatly. Within a couple of days of trading at these levels and the Dow could see a bearish crossover of these two moving averages. Even if they do crossover again in the other direction, we have to wonder if they signal that much more to the downside. As I mentioned in the paragraph above, support could be just 200-400 points lower. Any move off of these trend lines could be vicious to the upside, at least back to the 11,500 area and possibly back towards the 12,000 area where the top ascending trend line of higher highs is heading.
The Willliams %R indicator isn’t offering much guidance either. After giving a bullish signal and breaking above the oversold area below -80 a few weeks ago it fizzled quickly and has been sliding sideways for the most part in “no man’s land” which doesn’t give any indication of which direction has a bias. To wrap up this overall blah chart, I have to think the downside seems more limited than the upside, but neither looks too exciting. I’m staying long in my stock and index positions and keeping a finger on the sell button if support fails. Trying to catch 400 Dow points to the downside with a short position doesn’t seem worth the risk of missing 900-1,000 points to the upside.


