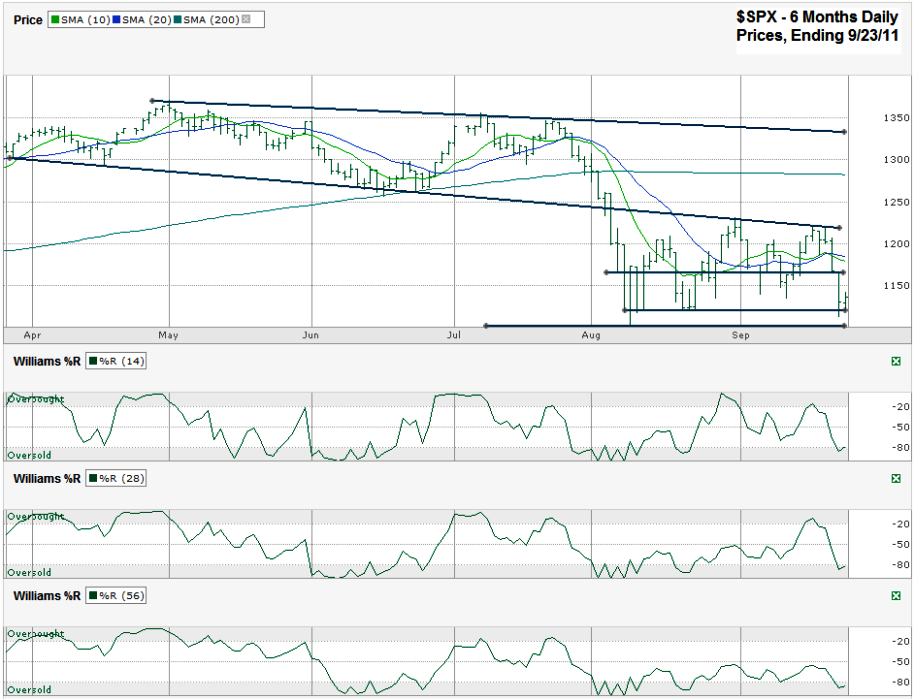
This S&P 500 ($SPX) chart shows the past six months of daily prices after the index finished the week at 1,136.43 on Friday, September 23, 2011.
The SPX has been stuck in a trading channel for nearly two months. By the end of the week the index was trolling the bottom of this channel, but with so much fear on the street it’s hard to see the masses realizing the opportunity at this level. Just following the pattern shows that there’s nearly 100 SPX points potential to the upside, but who wants to follow a pattern like this when so much has changed since the last visit to these levels? Has much really changed or is it that investors are just starting to come to grips with reality? Either way, the charts don’t care.
The trouble with basing a “buy” decision on the trading channel alone is that other indicators are issuing “sell” signals. On Wednesday the 10 day moving average (dma) fell below the 20 dma which typically acts as a good sign to exit. The Williams %R indicator broke down and it is often a good signal to watch to know when to sell. The true key will be to see if the August low of 1,101.54 holds. If we see a sell off that takes us down to this 1,100 range and then support surfaces then a rally could be well timed to take us into the end of the year. (That’s essentially what Art Cashin predicted on CNBC and in his newsletter on Friday; a choppy Friday – which we got – followed by a big sell off on Monday, followed by a rally of 20-25% through the end of the year.)
If 1,100 breaks to the downside then we could see another 100-150 points lower. If support holds (or even barely breaks) then money managers are going to want to jump in to chase the money and not be left behind. The first hurdle to get over will be the longest trend line shown below that was support, but has become resistance. It’s not far above 1,200 right now or about 10-11% above 1,100. A 10% gain is something none of us wants to miss. If we get that far, be ready to sell if resistance works a third time on this trend line. If resistance doesn’t resist, then we could see the S&P 500 all of the way back up to the 200 dma which is close to 15-16% above the 1,100 area. Following Cashin’s theory of a 20+% gain possible, the SPX could go all of the way back up to its trend line of lower highs around 1,335+-. That would be a rally of 20-21% and we might even see it overshoot to 1,350 to equal the July 2011 highs. We’ll be reassessing all the way there and will figure out our next steps IF we even get there in the near term.
Whichever direction we go, don’t expect it to come in small chunks. Q4 stands to be a hold onto your seat kind of ride.


Bet you’re glad you got out of ITRI recently at $35.30 after todays action 🙂
No kidding. It’s down under $30 late in the day today (9/30/11). At least I make some good moves sometimes.
Yeah, I’ve had a few dogs lately too but I suppose that’s to be expected when the market is now 17% below it’s peak this year.
I was reasonably lucky last month in that my DSX were called away via Calls at an 8 strike and I resold October 8 Puts to get back into half the position last week. That’s turned into a bad decision so far but I may double down at a 7 strike next week.
By far, my biggest dog this year has been RIMM.