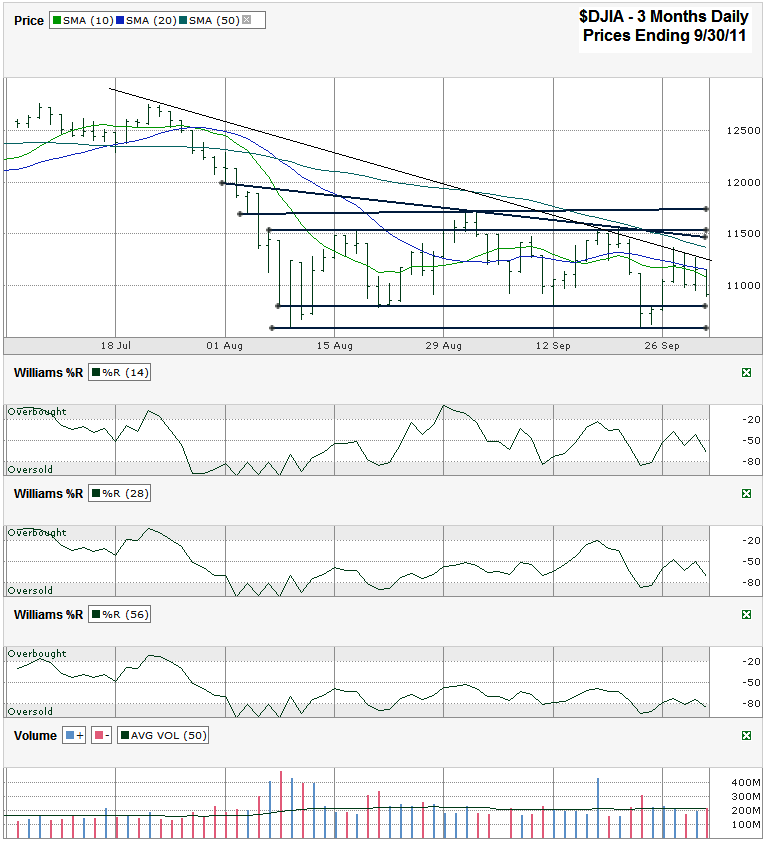
I charted daily prices for the past three months (Q3) on the Dow Jones Industrial Average ($DJIA, $INDU, $DJI) after it closed on Friday, September 30, 2011 at 10,913.38. The surprise of this past week is that it ended higher than the previous Friday’s close. The final three days of the week made it feel like the week had to be a wash, but Monday and Tuesday’s gains saved the week.
The market has been in such a sideways pattern for so long now that some of my favorite technical indicators are not helping much. If they worked every single time then everyone would use them. I believe that we’re in a patch that is based almost solely on a sideways trading pattern and most other technical indicators will be moot until we see a break to the upside out of this trench. I filled the chart below with horizontal lines for the most part. These lines show the main borders of the trading channels and areas to the top side that have been good selling opportunities and areas on the low side that have offered good buying opportunities. The downside support levels are now closer than the upside resistance levels which opens the door to investors and traders who can stomach the risk of a potential break in support.
To the upside I included a thin black line that will be a potential key descending trend line to watch. It marks the intraday highs from four days in this past week and started with the intraday high in late July. That will be the first test to the upside on the way back to the 11,500 area that has proved tough to vault recently. To the downside the DJIA is very close to its first area of support. This is a good test, but not the only one that matters. The lower line has been tested once so far after the initial August low. A second test (third time down) could be all the markets need to launch another rally. More conservative investors would likely want to wait to see if this line in the sand holds again before taking any long positions. All of us should be ready to sell if that line breaks.
Although the moving averages haven’t been as helpful recently as they usually are, pay attention to the 10 day moving average (dma) and the 20 dma. Watch for another 10/20 crossover for a bullish signal. I got caught out by the “head fake” on Tuesday when the Dow peaked its head above both of these moving averages only to retreat soon after in the same day. The safer trade is to wait for the crossover to happen, not just look like it’s close to happening (like I did). Ideally this crossover will coincide with the Williams %R indicator breaking above oversold for at least three days. I preach this all of the time and yet I went bullish during the second day higher. Had I waited like a smart trader I’d have save some money. There’s nothing like another few thousand dollar lesson to help you remember the next time around. For now, the Williams %R indicator isn’t telling us anything as it treads through no-man’s land.
Stay nimble. The market is likely to break out to either side during Q4. The chances of staying within this trading channel are very slim for another three months.


