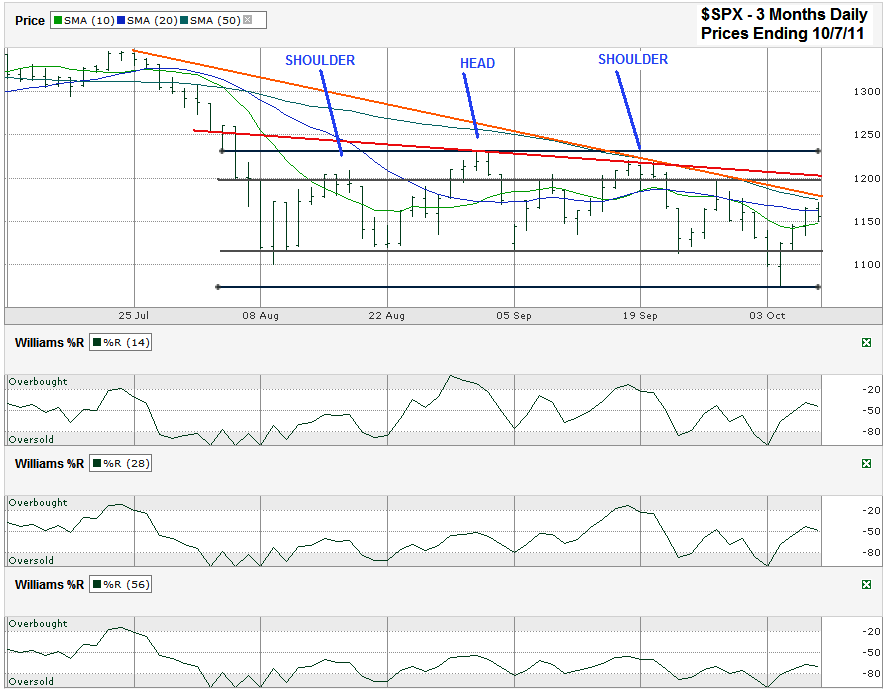
This S&P 500 ($SPX) chart shows the past three months of daily prices after the index finished the week higher at 1,155.46 on Friday, October 7, 2011.
The large cap index has been stuck in a trading channel for two full months now with the extreme top side around 1,230 and the bottom plumbing a new recent low at 1,074. The majority of the daily prices have traded in a narrower range between 1,200 on the upper limit and 1,120 to the downside. Active traders have found this an easy range to operate in – sell when it gets closer to the top and buy when it approaches the bottom. Moving averages and other technical indicators such as Williams %R have not factored in with their usual precision during this period, but that might be changing soon.
A classic pattern for technicians to watch for is a “Head and Shoulders” pattern. The SPX created just such a pattern over the past two months and could be positioned to react to it. In a head and shoulders pattern a stock or index has three peaks with the middle one higher than the ones on each side, much like a head is higher than the shoulders that border it. After the second shoulder fails to reach a new high the next step moves lower in a final wash out before a lasting surge higher. Not every head and shoulders pattern turns into a new lasting rally so the key is to decide when to add additional exposure. Most technicians wait for the “neckline” to break. This line is marked in red in the chart below and is edging close to the 1,200 area. A breakout above this neckline accompanied with high volume is a screaming buy signal for technicians and tends to signify a new longer leg higher has begun. Failure at this line can send the stock or index to new lows.
The current chart isn’t completely cut and dry with this approach. On Friday, the trend line of lower highs (shown in orange below) that started in late July came into play and acted as resistance before the SPX could make it up to the neckline. This line happened to coincide with the 50 day moving average (dma) which is the only dma that has remained reliable as resistance during the past two months. After failing at these two points the 10 dma held support at the 1,150 line where previous temporary support and resistance has worked repeatedly over the past 60 days.
Eventually Williams %R and the 10 and 20 dma will regain their predictive powers. If their time has come it’s worth noting that Williams %R has moved above the oversold area for multiple days consecutively. Seeing one or two days above the oversold area is not as important as the second and third confirmation days for Williams %R. This past week saw those confirmation days on the 14 and 28 day periods and is close to it on the 56 day period. If Monday is a positive day for the S&P 500 then Williams %R could beckon in more buyers. At the same time the 10 and 20 dma are setting up for a bullish crossover if the index can stay above both of these lines for a few days. These two indicators could be setting up for bullish signals at the same time the SPX breaks above resistance from the neckline and trend line of lower highs to create a chorus of buy signals. If any of these fail, then the chances of all of them failing and the market moving lower is fairly high. Waiting for a clear buy signal is worth missing out on a few points to the upside in case the next big move is lower.
Key Levels:
- 1,277.3 – 200 dma
- 1,200 – top end of trading range and current approximate neckline level.
- 1,179.9 – 50 dma, offered resistance on Friday
- 1,170 – trend line of lower highs
- 1162.7 – 20 dma
- 1146.8 – 10 dma, offered support on Friday


