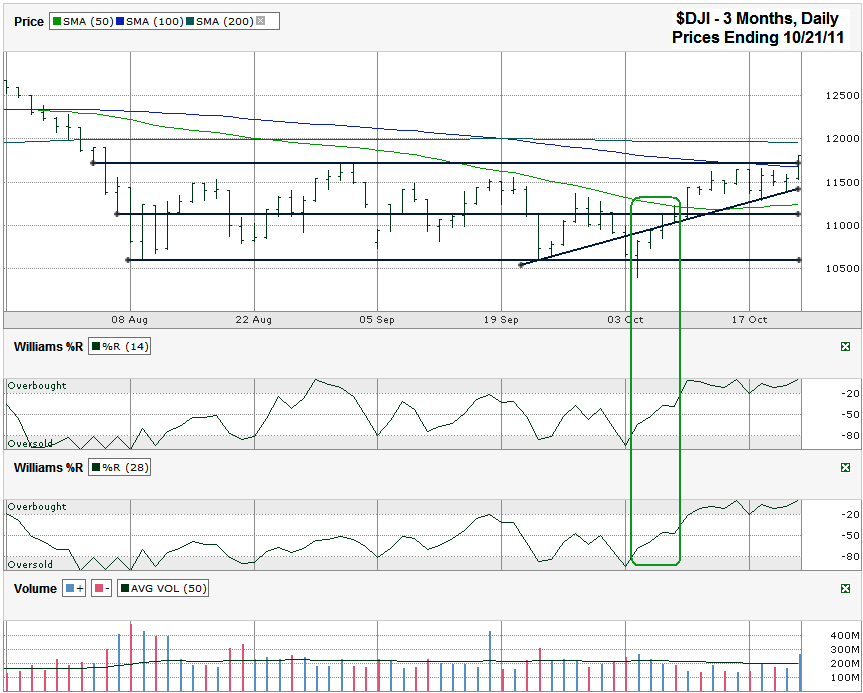
I charted the Dow Jones Industrial Average ($INDU, $DJI, DJIA) after the markets closed on Friday, October 21, 2011, as it closed for the week at 11,808.79.
After being completely stuck in a sideways trading pattern for two and a half months the DJIA finally moved above its 100 day moving average (dma) and its previous high of this trading channel. One big day above the previous high doesn’t mean there is no downside risk remaining, but it does open the door to more upside.
It wasn’t just this line in the sand that makes the Dow Jones chart look bullish. The signs have been building up. More than a week ago we saw the 10/20 dma (not shown below) bullish crossover I like for forecasting bullish turns. A few days before that Williams %R broke above oversold. The issue with Williams %R recently is that it has given a few false positives. This time (highlighted in green) looked different though. I like to see two or three confirmation days after the initial break above the oversold range. This most recent move only gained steam after the third confirmation day and that gave the clear buy signal, especially coupled with the 10/20 dma crossover.
As timing would have it, these two buy signals also met up fairly closely with the Dow moving above its 50 dma for the first time in two months. Since closing above it on October 10, the Dow has not closed below it again yet. I wouldn’t be shocked to see a retest of this line again before another leg higher, but the October 18th dip could be enough of a retest to scratch that itch. With the moving averages falling one after another the DJIA has worked its way nearly back up to its 200 dma. This will be yet another new test to see if it can keep the rally going. Now that it has had a reversion to the mean there might not be a ton of upside left. The best hope for bulls will be left with the theory that money managers will be required to buy into the rally to keep from being left behind. Just as the decline became a self fulfilling prophecy, an upside run could do the same.
All of this could be moot again when the next shoe drops on the European saga. For now, the issues in Europe are easily playing into the chart’s patterns. A slip in the next few days by European leaders could also be read as a failure at the 200 dma. Either way, be ready for a reversal to let the bears take over again just as much the potential for another bull stampede into the end of the year. In other words, we’re very close to a tipping point that could kick the index 10% in either direction.


