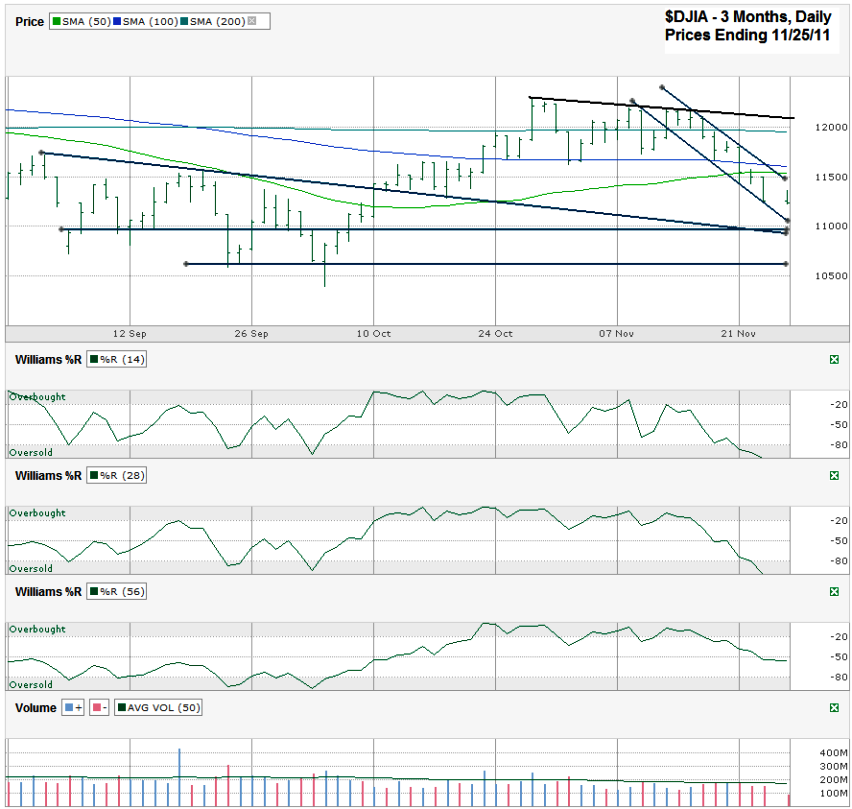
I charted the Dow Jones Industrial Average ($INDU, $DJI, DJIA), after the markets closed on Friday, November 25, 2011, after the Dow closed for the week at 11,231.78.
The Dow is almost in no man’s land on its chart. It’s below its 10, 20, 50, 100 and 200 day moving averages and has decent space before it hits the next support or resistance level. The one trading channel that could continue to work is the trend line of lower lows and lower highs that started just a couple of weeks ago. This is a very steep descending channel and won’t last too much longer in its current narrow path. Its first true test to the downside will be at the 11,000 area. This area has played speed bump a few times recently and could be ready for another similar move. Below that, DJIA could make it all of the way down to its multi-month closing low at 10,655.30.
That looks like the direction the index is headed for, but Williams %R shows that it is at absolute oversold levels. In an extremely rare occurrence, it looks like the line for the 14 and 28 day periods has actually run off the page. However, the 56 day period hasn’t even made it down to the oversold level yet. A true wash out should move all three periods to oversold and the buy signal won’t be until they all move out of the oversold area. This looks like it’s shaping up to be a leveling point that could melt lower a little more while the 56 day period catches up.
It’s hard to want to catch a falling knife right here and start buying, but it might not be a bad place to cover any short positions. Such extreme oversold conditions are often followed by a quick short squeeze. Getting neutral before that can be a good way to preserve capital.


