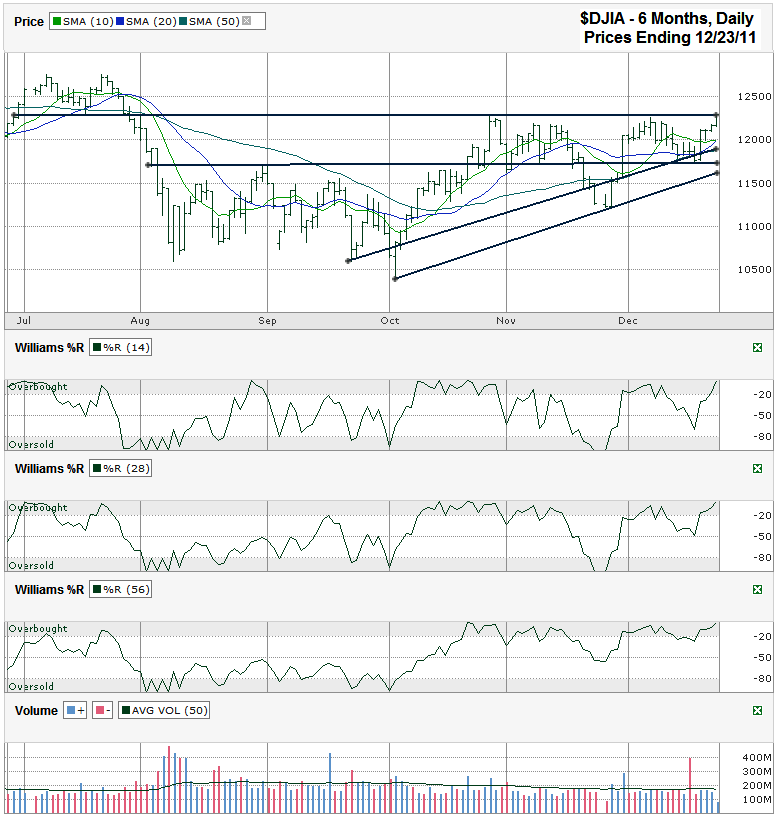
I charted the Dow Jones Industrial Average ($INDU, $DJI, DJIA), after the markets closed on Friday, December 23, 2011, after the Dow closed for the week at 12,294.00.
The Dow lurched higher during the few days leading up to the Christmas holiday only to reach the area of previous resistance by the time the closing bell rang. Without this line of resistance having such a powerful track record, the other technical indicators would lead technicians to believe the index was ready to move higher still. Those other indicators such as trend lines and moving averages have proven to be false positives in the past few months. A move to new recent highs all hinges on breaking this resistance. (That’s kind of obvious, a move higher depends on stocks moving higher, but you know what I mean when you look at this chart.)
If resistance wasn’t looming like it is, we’d be able to rely on two trend lines of higher lows drawing in closer to the DJIA’s current levels. Typically that would mean support was nearby and we’d expect another leg higher. The crossover of the 10 day moving average (dma) over the 20 dma was a reliable bullish indicator before late August. Lately the crossover has indicated a good place to take profits. The reverse crossover appears to be close to occurring again, but the index moved north of this crossover and could foil it as it pulls the 10 dma higher again. Sometimes, like any technical indicator, it doesn’t pan out so easily. If it did everyone would use it without fail. When I’ve seen it fail in the past, the crossover typically works on the second occurrence soon after.
Last week’s run higher kind of felt like traders were trying to game the “Santa Claus” rally that typically hits the week between Christmas and New Year’s Day. Based on the expectation that a rally was due this coming week, traders bought in early and maybe pulled it forward a week so that we won’t see follow through worth much now. You can also see this in the Williams %R indicator based on it being very close to the extreme top end of the overbought range. This shows momentum might have topped out and is now due for a breather, even if it’s for a short period.
The convergence of the horizontal line of resistance with the two trend lines of higher lows should force a decent sized move (up or down 5% or more) within the next couple of weeks. Without my typical go-to indicators being as reliable these days I’ll have to stay more to the sidelines until there’s a better move higher. The path of least resistance looks to be to the downside, in spite of the higher trend line of higher lows. The lower trend line is probably the better one to watch, especially as it converges with the lower horizontal line that has acted as resistance and then support for months.


