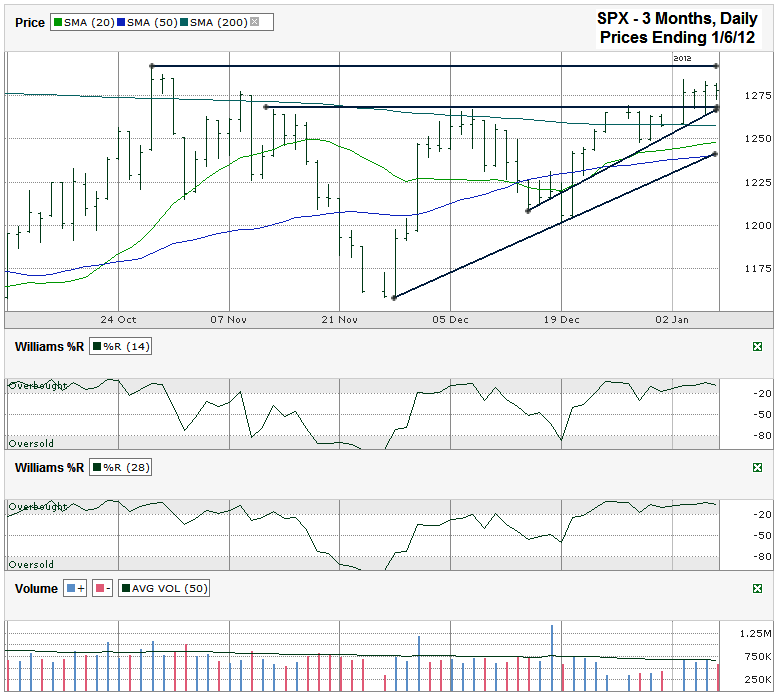
This S&P 500 ($SPX) chart shows the past three months of daily prices after the index finished the week at 1,277.81 on Friday, January 6, 2012.
The S&P 500 is approaching resistance at its October 27th intraday high of 1,292.66 and volume will likely stay light until the large cap index can move past this key technical level. The bulls have the advantage going into this challenge based on several technical indicators. These indicators include a bullish chart pattern, bullish moving averages and momentum as seen through the Williams %R indicator.
SPX has two ascending triangles within this chart. The smaller one has a horizontal line around 1267 and an ascending trend line of higher lows that converged with it on Friday. Using this bullish pattern alone indicates a break out is due that should take the index another leg higher during the current rally. The larger ascending triangle started with the October 27th intraday high and has an ascending trend line of higher lows that is moving higher at a lower angle. These two lines still have weeks remaining before they converge. As happened with the smaller triangle, a period of consolidation is expected at the horizontal line. If the line of resistance breaks and stocks are allowed to move higher, then volume should surge above its average and stocks should leap higher.
The moving averages support this bullish outlook. The 200 day moving average (dma) has been a strong point of resistance for months. The index moved back and forth across this moving target during the last week of December and finally started to use the line as support rather than resistance. Technicians expect one more test of support on the line before the SPX can move higher freely. This retest could come at the same time the longer trend line of higher lows reaches the same point to offer further support. In addition to the 200 dma, the 20 dma had a bullish crossover above the 50 dma in the second half of December. By the end of December the 10 dma (not shown) moved above the 20 dma for further emphasis of the trend.
After the bears failed to push the S&P 500 to new lows after December 19th, the bulls regained momentum. Although volume did not accompany the move, Williams %R showed the clear momentum shift. Technically, stocks are currently shown as “overbought” in the Williams %R indicator. As history has shown, being overbought is not as important as when it stops being overbought (a move below -20). Indexes can stay elevated for weeks if not months. Waiting for the break in momentum is the time to sell, not while momentum is still bullish.


