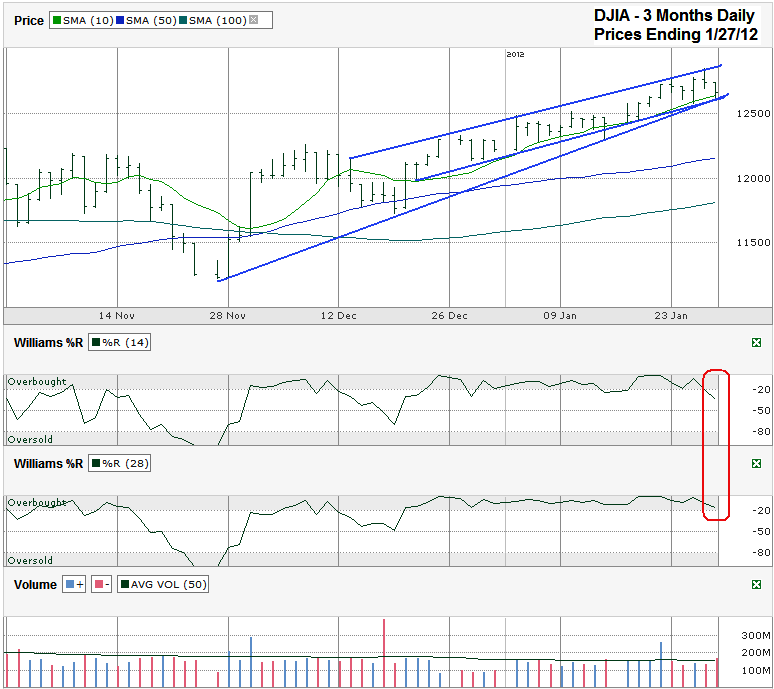
I charted the past three months of daily prices for the Dow Jones Industrial Average ($INDU, $DJI, DJIA) after the index closed at 12,660.46 on Friday, January 27, 2012.
At the beginning of December, I charted the S&P 500 index and pointed out how the 50 and 100 day moving averages (dma) crossover tends to foretell the early days of a longer bull market. So far that prediction has held true. These moving averages had their bullish crossover on December 1st on the DJIA chart too. Since then the Dow has pulled away from its 50 dma by more than 500 points. During this run higher the index has followed a tight trading channel as shown by the three trend lines in the chart below. Each touch on the upper end of this trading channel’s trend line of higher highs sends it lower for a few days until one of the lower trend lines of higher lows comes back into play. On Friday the two lower trend lines converged just below the 10 dma and acted as support.
Now the question is – how much longer can this tight trading channel last? It’s uncommon for stocks to maintain such a narrow trading range for more than a month, if even that long. It’s been more than 31 days for the DJIA so far. In all likelihood this collection of 30 large cap stocks won’t maintain its trajectory for much longer. Another trip to the top end of the channel could be its last move to these elevated levels for weeks. We might not even see it get back up there before the Dow finally cracks again.
Investors should watch the trend lines of higher lows and the 10 dma to see if any of these technical indicators break support. The 10 dma has broken support intraday only a few times since mid-December, but always closes above it by the market’s close. The same thing happened on Friday again. Closing below it will be the first major red flag for bulls. The warning goes for the shortest trend line also. Now that this chart’s longest trend line is moving above the shortest trend line, the space the Dow will be “allowed” to trade within will be increasingly narrower as it chases the upper trend line. One line will have to give and it tends to be the lower ascending line more often than the upper ascending line.
Once support breaks the next question will be – how far will the DJIA fall? As I mentioned at the beginning of this analysis, the 50 and 100 dma crossover tends to spell out longer bull market rallies. That doesn’t mean we won’t witness a few minor corrections along the way. Investors should expect the DJIA to test its 50 dma multiple times during this extended rally. A move back down to its 50 dma from Thursday’s intraday high would mark a 5% correction and could be all the market needs as a catalyst to reduce allocations from bonds and into equities. The first half of 2011 was filled with 4-5% mini-corrections. 2012 is ripe for one.
The first small hint that the move lower is upon us can be seen in the Williams %R indicator. It fell below the overbought level on the 14 day indicator by the end of the week. It needs a couple of confirmation days lower along with the 28 day period cracking too for it to show a true sell signal. At this point, even a single confirmation day could also bring about a close below the three demarcation lines I mentioned above. It’s time for active traders to be ready to take some profits or add some hedges. Investors focused on the longer term might not need to panic yet. The chance of a sell off beyond 5% is low, but could quickly change if the 50 dma doesn’t hold support. Stay nimble and watch the charts.


