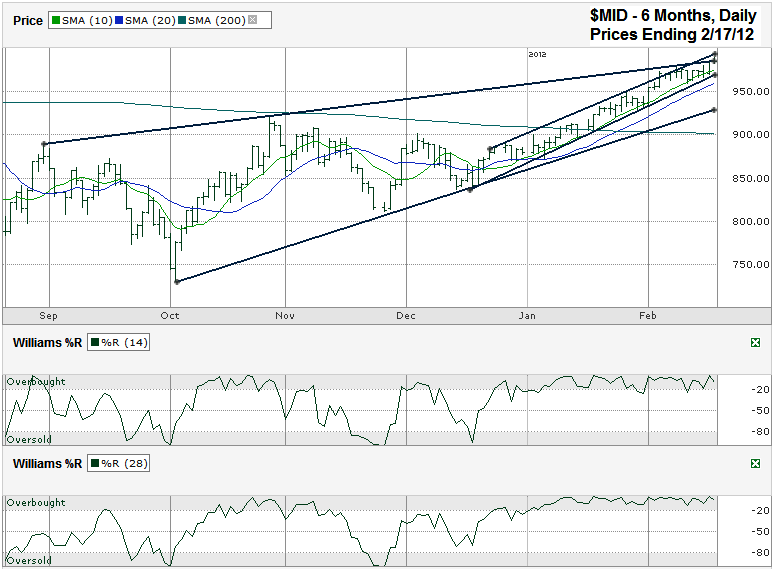
I charted the past six months of daily prices for the S&P 400 Mid-Cap Index ($MID.X) after the index closed at 984.60 on Friday, February 17, 2012.
In most of my charts recently I’ve been posting three month periods of indexes. The main reason was to be able to focus on the near term trends without drawing too many lines on top of each other. I stretched it out to six months today to include the longer trend lines of higher lows and higher highs.
The only trading channel that has mattered since the middle of December has been narrow and has run closely with the 10 day moving average (dma) for support. That hasn’t changed. The twist is a new influence might be in play again. The trend line of higher lows that started at the very end of August and was touched at the end of October is back as a potential point of resistance. If this longer trend line does act as resistance again, the move lower could go back towards 930 for the mid-cap index. A dip like that would only be a 6% correction and should reset the balance somewhat after such a long narrow path higher. Traders who missed the most recent run higher might be more willing to buy in again after a 5-6% move lower for fear of missing the next leg higher. Depending on what the macroeconomic catalyst is that causes a move lower, we could see the mid-cap stock index move back to its 200 dma. I don’t think we’re to the point of this moving average losing support yet. So 9% lower from Friday’s intraday high might be the worst we could see in the near term.
Before that can happen the current tight trading channel has to give in and the chart doesn’t show signs of that yet. The 10 dma has been breaking intraday more often lately, but the $MID continues to close above it by the end of each trading day. The real lines to watch are going to be the shorter trend line of higher lows and the 20 dma. Once these break for two closing days in a row, expect more of a slide. At some point these two longer trend lines will converge and the index will fall below the lower one. They still have too much room in between them to demand much worry yet, but since I rarely chart the mid-cap index it is worth pointing out in this chart.


