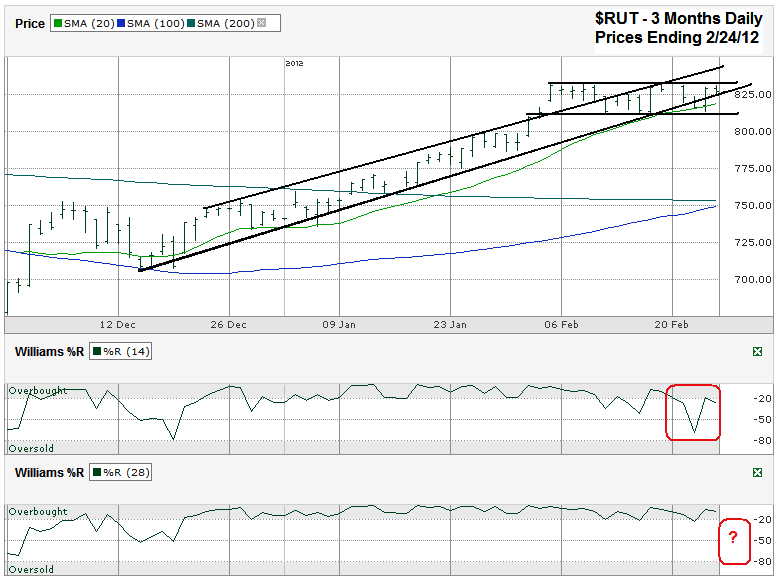
I charted the past three months of daily prices for the Russell 2000 Index ($RUT.X) after the index closed at 826.92 on Friday, February 24, 2012.
The small cap index had a great rally from the middle of December through the first few days of February. That’s when it broke out of its narrow trading channel and then ran into a cement ceiling. From there, the Russell 2000 moved sideways to slightly lower for the next three weeks. This narrow horizontal channel has the index stuck between 810 and 830. These are the two make it or break it levels for both sides. A move outside, followed by a confirmation day or two should indicate another few weeks of movement in the same direction are in store for it. The longest line shown below is the trend line of higher lows. It broke twice intraday this week and even closed below it once, but didn’t get the confirmation day the bears needed to bring in a large number of sellers yet. Still, it raises a red flag for the bulls who should be nervous by this point. Until this trend line breaks, this sideways channel can be viewed as a healthy consolidation period. The bears should have their turn again when it breaks. Unfortunately for the bulls, the cement ceiling is still in place and by Monday these two lines will converge.
It’s possible the sideways trading channel could last a little longer, but the 20 day moving average (dma) is starting to cut through the 810 – 830 zone. Because it’s a moving average it won’t climb above the trading channel like the trend lines have. Instead it will flatten out if $RUT can’t find space above 830. The 10 dma (not shown) has already started to flatten and even has moved a little lower recently. In the very near term we should expect to see a 10/20 bearish crossover. If the Williams %R indicator falls below the overbought range on both the 14 and 28 day periods we will know the bears are back at the reigns.
The big question when support breaks will be how far does the small cap index have to fall before it finds support again. It could be just 4-5% is the only shake-up needed after such a long run and multi-week consolidation period. If that doesn’t bring the bulls back, a move towards the 100 dma and 200 dma is reasonable to expect. Typically the 100/200 dma crossover is bullish, so don’t expect a break below these lines. It’s even odd to see a sell off at the time of a crossover, but the index is roughly 9% above these moving averages and at some point will require a reversion to the mean. The past three weeks have helped, but a quick dip could satisfy that need very quickly and allow another strong rally to kick off through the spring.


