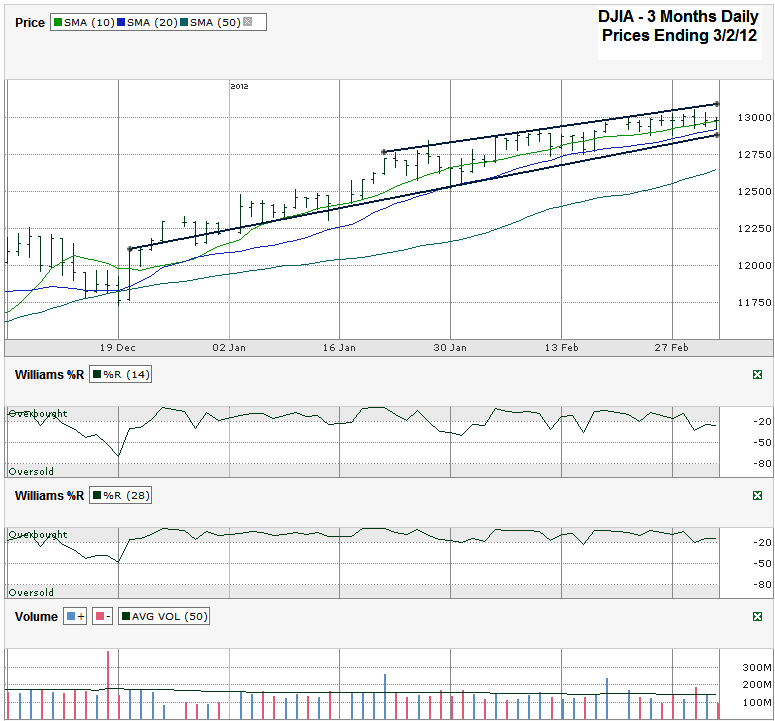
I charted the past three months of daily prices for the Dow Jones Industrial Average ($DJIA, $INDU, $DJI) after the index closed at 12,977.57 on Friday, March 2, 2012.
Nothing has changed in the past few weeks. I could almost recycle a chart analysis from a couple of weeks ago and just change the date. The DJIA has stayed within its trading channel between the trend lines of higher lows and higher highs. I drew the lower trend line (higher lows) a little below its actual trajectory to make the 20 day moving average (dma) visible. Just as the trend line has held support for months, the 20 dma has been a rock floor for just as long.
The only difference is that the 20 dma has come into play more often recently. The testing of this indicator raises a red flag and gets a trader’s hands ready to pull the trigger, but does not mean it’s time to sell quite yet. The 10 dma is acting the same way. It has broken support multiple times intraday, but hasn’t had that multiple day break the bears want (yet).
Just as I predicted correctly in the Russell 2000 chart last week, once these two moving averages cross over each other we should expect some downside movement to finally surface. The gap between the Dow’s 10 and 20 dma hasn’t narrowed much yet, but each time the 10 dma breaks and the 20 dma holds support it draws in a little closer. In essence, the index is just giving traders an early warning shot to allow us to prepare for the inevitable. The Williams %R indicator hasn’t given a sell signal yet either, but just as the 10 and 20 dma are hinting, so is this indicator. The 14 day period has cracked a few times below the overbought area, but the 28 day period hasn’t succumbed to the pressure yet. The 28 day period has gone nearly two and a half months in the overbought area. Each week that passes without a move lower increases the potential size of the next correction.
Traders are getting a lot of hints of what’s to come, but very few indicators say to sell quite yet. At the same time, adding new downside risk at this point might not be the best trade. Perhaps the small cap index is just the beginning and large cap stocks will follow the pull back soon. The 50 dma might be the first target for support on any dip. Even a move down to previous resistance (which would now become support) around 12,250 would only be a 6% correction from last week’s multi-month high. That could be all that’s needed to get another sustainable rally moving.


Alex, taxtime on UCO–do we get K-1 on option trades and when? I can’t find any info on it. Regards.
Ruben, yes – they’ll send you a K-1. I think I’ve gotten them as late as May in the past. The same goes for USO. I don’t know how they get away with sending tax forms out so late. I guess it’s different than W-2s and 1099s.