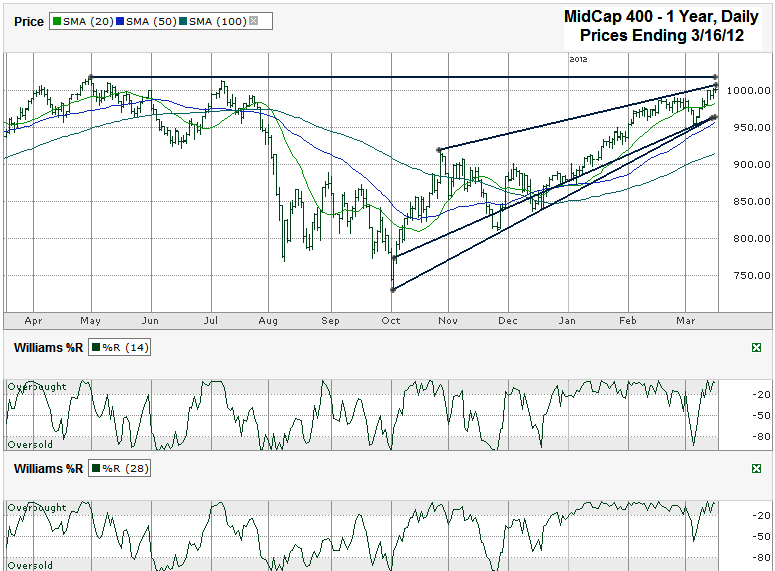
I charted the past year of daily prices for the S&P 400 Mid-Cap Index ($MID.X) after the index closed at 1,000.73 on Friday, March 16, 2012.
I’m short on time this weekend, but a lot of this MidCap 400 chart speaks for itself. Resistance could surface from the previous high last spring and from the trend line of higher highs that started this past fall. That leaves room for a little correction down to the trend lines of higher lows which is only 3.5% lower than Friday’s close.
A small dip like this is possibly all the market needs to take off on another leg higher. This area of support happens to coincide with the 50 day moving average too. Williams %R hasn’t given a hint that a large turn around is near, but it never does until the move has already started. It’s at extreme overbought levels, but that can be the difference of just a few points lower within the next few days before calming down again. Keep an eye on this indicator to foreshadow bigger moves than just 3.5%.


