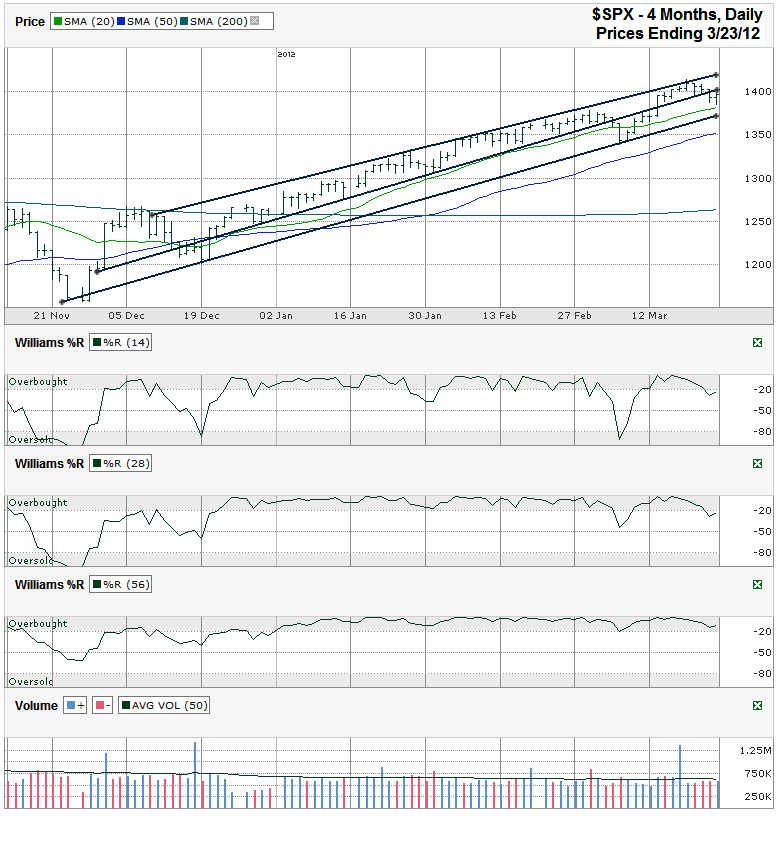
This S&P 500 ($SPX) chart shows the past four months of daily prices after the index finished the week at 1,397.11 on Friday, March 23, 2012.
The S&P 500 made yet another trip to the top of its trading range, but found resistance at the trend line of higher highs. As has been the case since this trading channel began, hitting this trend line has triggered a break in buying. The trick every time is seeing if that is the last touch to the line before a real correction begins or if it is just another breather before the bulls catch another wind.
A couple of weeks ago the middle trend line I drew that marks the line of higher lows broke. That looked like the start of a bigger correction, but buyers resurfaced after the 20 day moving average (dma) broke support for a single day. The index took only one more day after that to make it back above the 20 dma again. That bounce took the collection of 500 stocks back to the upper trend line. On Thursday, the middle trend line broke again, so we have to see if the lower trend line is the new line to watch or if the long standing trading channel is finally ready to end its reign.
The 20 dma is going to be key to watch again. It’s close enough to the trend line of higher lows that they could both break support in the same day. As was the case a couple of weeks ago, one day doesn’t equal a sell signal. It is more important to see how the one and two days after behave. Continued selling begets more selling and a new leg lower is quickly in motion. The 50 dma isn’t much below that break and could offer another area of support. A 5% correction (which was often the magic area last year before the bigger fall) would take the SPX down to 1,343. That’s close enough to the 50 dma that they could work together.
Unless another major macro event hits from Europe (maybe Spain or Portugal?) in the next few months a correction beyond 5% isn’t terribly likely. The more likely case is that a 4-5% correction is all the market needs to refresh itself a little better and keep the bulls “honest”. Beyond the 50 dma is the 200 dma. A fall that low (which will happen again one day) is 10+-% below the recent SPX high. A fall to that range has the double potential of support like the 50 dma. One is the round 10% retreat which is common for a correction and the other is the 200 dma which is always key to watch. Any fall below that should be fairly brief and wouldn’t be too risky for longer term investors.
Before any of that can happen, chart watchers will be able to see a good warning from the Williams %R indicator. I included three time frames in this week’s chart, 14, 28 and 56 days. The 14 and 28 day charts gave false signals a couple of weeks ago, but only if you didn’t wait for the confirmation day on the 28 day indicator. By the second full day of declines the 28 day was recovering. Waiting that extra day can save an itchy trigger finger from selling too quickly. The 56 day period hasn’t rollover yet this year. This has become the real line to watch for a sell signal. The first two will be good to put us on guard, but the 56 day indicator will be the best fortune teller for a true correction beginning.


