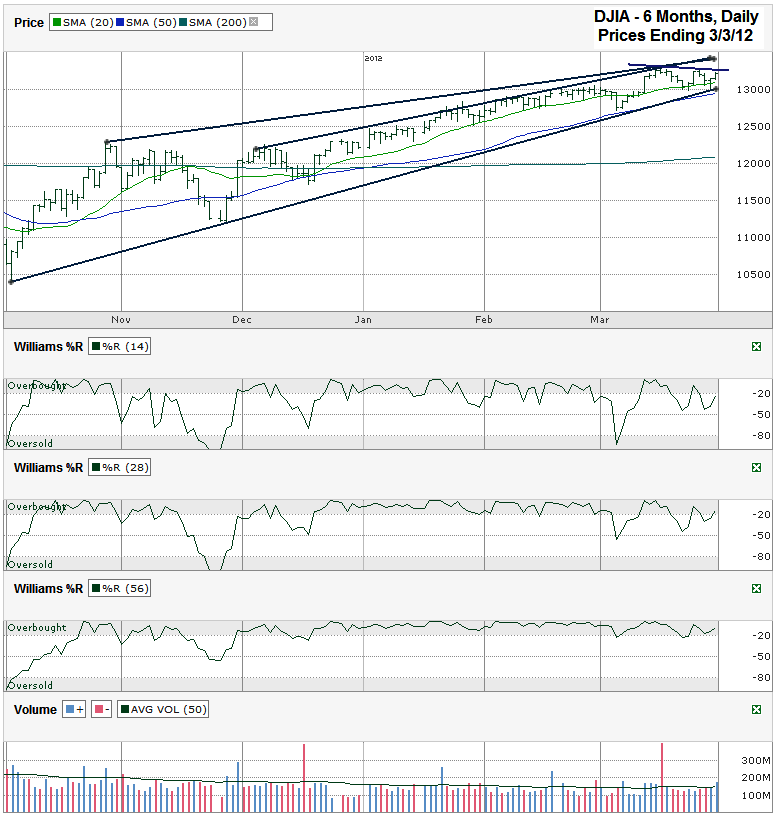
I charted the past six months of daily prices for the Dow Jones Industrial Average ($DJIA, $INDU, $DJI) after the index closed at 13,212.04 on Friday, March 30, 2012.
The trend lines of support and resistance that have been in place for the past six months are still holding true, but are inching their way towards a convergence within the next couple of months. When that happens one side is forced to give in and it is usually the trend line of higher lows. This means the Dow is at an interesting place again as the springtime selling season is knocking at our doors.
The Dow is at an interesting place right now. It just bounced off of its lower trend line and is on a path towards the upper trend line again, but stopped on Friday at a new little line that could end up being resistance. Friday was the first real test of this line, so next week will show if it was a coincidence or not. This descending line comes from high seen in mid-March and touched again with the lower high at the beginning of this past week. Keep an eye on it. The break between it and the long trend line of higher lows won’t take long to show.
The Williams % R indicator has been somewhat jumpy during March. The 14 day indicator broke below overbought weekly and the 28 day indicator even gave in three times. Outside of the first break in the 14 day, the rest of the breaks didn’t have multiple confirmation days. This means they never actually triggered sell signals. The smoother 56 day indicator hasn’t broken below overbought in 2012 yet. It will lag behind the first few percent of a decline, but will be a better indicator for more serious corrections to come.
The blue 50 day moving average (dma) is barely visible behind the straight trend line of higher lows, but it’s there. The 50 dma has stayed below the index for three and a half months, but is getting closer and closer again. The green 20 dma held for two months and then saw three breaks during March, all with quick recoveries. The 50 dma might not be as forgiving, especially if these two get to the point of a bearish crossover.
A lot of technicals are drawing closer lately and the DJIA seems to be on a tipping point, but for now it is still within its upward trend and it’s hard to want to sell a bull market without a clearer indicator. The only short term trade coming up could be to dump DJIA stocks (or DIA) when the index returns to its upper trend line. Eventually the Dow will rollover for a bigger correction.


