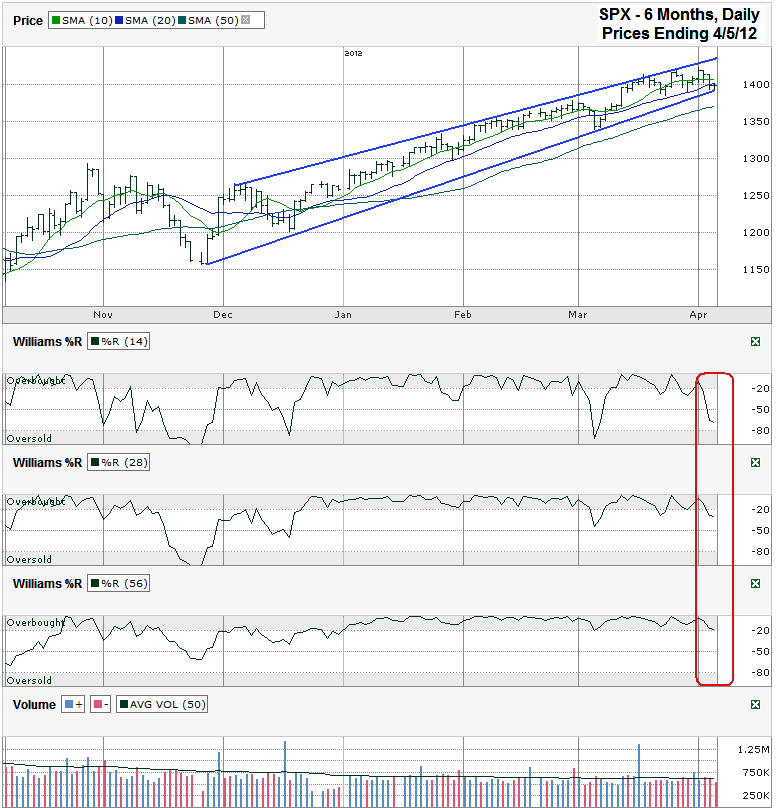
This S&P 500 ($SPX) chart shows the past six months of daily prices after the index finished the week at 1,398.08 on Thursday April 5, 2012.
Thursday’s close left the SPX in a precarious position. It remained above its four month trend line of higher lows, but closed below its 10 and 20 day moving averages (dma). A the same time the Williams %R indicator fell below the overbought area for the 14 and 28 day periods. The 50 dma and the Williams %R 56 day indicator have not given in yet. That could change as early as Monday when stocks resume trading after a disappointing employment report on Friday when US markets were closed for the holiday.
Futures traded for an hour after the data was released and indicate a much lower open after the weekend. Such a lower open will pull the 10 dma lower quicker than the 20 dma falls. Short based moving averages move quicker than longer ones and will lead the SPX chart to show a bearish 10/20 dma crossover within days if stocks don’t snap back quickly. This is often a signal of the beginning of multiple days or weeks lower for an index or stock. The first possible area of support for a declining market will be at the 50 dma which is currently around 1,370 and moving higher. If support surfaces this early, the market will have only corrected 3.6% from its recent intraday high.
The Williams %R indicates a bigger fall could be coming. As mentioned above, the 14 and 28 day periods already show a change in momentum. A lower close on Monday will give the 14 day indicator a key third confirmation day and a second confirmation day on the 28 day indicator. The 56 day period has not registered a day below the overbought area in 2012. Monday’s open is likely to push it below overbought and will show a true momentum shift is underway.
Volume trailed off going in to the holiday weekend and should see a spike on Monday as anxious traders return to their desks ready to pare losses or profit from the decline. In the past two years, spring has been the time to exit stocks temporarily and the market has lived up to its mantra, “Sell in May and go away”. The changes in these technical indicators could be an early warning that the selling season has started a month early and taking profits in April might be a safer trade than waiting until May this year.


