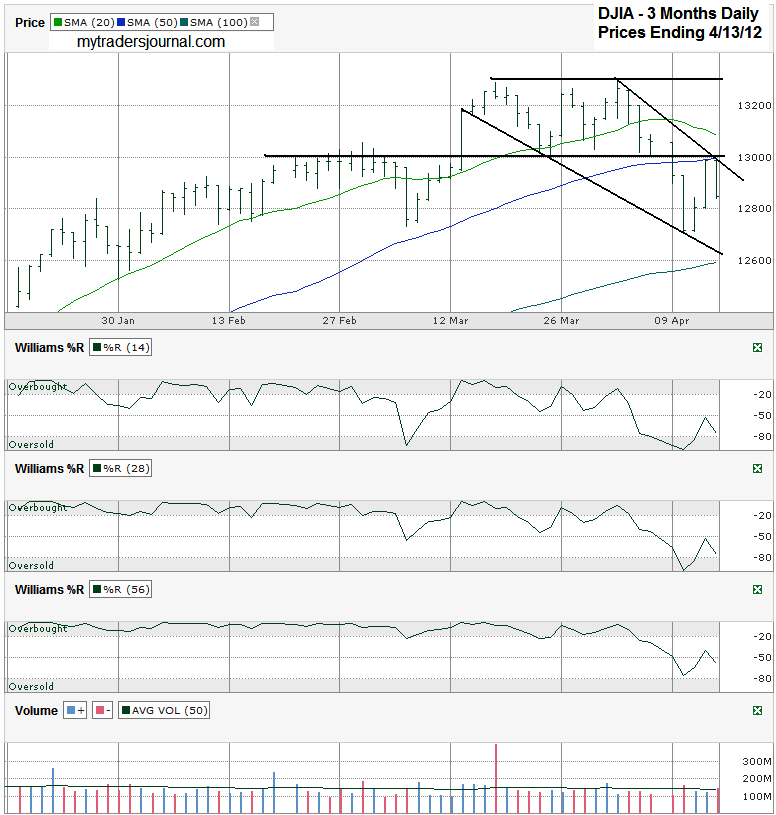
I charted the past three months of daily prices for the Dow Jones Industrial Average ($DJIA, $INDU, $DJI) after the index closed at 12,849.59 on Friday, April 13, 2012.
The moving averages have been the story lately for the large cap index. Last week I pointed out the S&P 500 was headed for the 10/20 day moving average (dma) bearish crossover. The Dow followed the same path too. I didn’t show it on this chart, but it happened on Monday, the day after the index closed below the 20 dma. That sent the DJIA below previous the horizontal support line around 13,000 and opened the flood gates. The real technical trigger for the big sell off on Tuesday came from Monday’s close below the 50 dma. This was the demarcation line for many traders and when the Dow couldn’t climb back above it by the end of trading Monday, nothing was left to do, but to sell.
Support surfaced when the short trend line of lower lows came back into play. This equaled a 4.4% drop from the intraday highs seen just a week earlier. I had called for a 5% correction, but this was close. The rub is that I’m not so sure that the descent is over yet. The 50 dma acted as resistance on Thursday and Friday. Spain’s worrisome story is growing in the minds of investors. May’s selling season is just a couple of weeks away and the mood has already shifted on Wall Street.
Williams %R, which tracts technical sentiment shifts, started signaling the downturn more than a week ago. Outside of the one day move above the oversold area, Williams %R is still signaling that the bears are in control as it trends lower on the 14, 28 and 56 day indicators. The next areas of potential support could come from a retest of Tuesday and Wednesday’s lows or the trend line of lower lows as it converges with the 100 dma. 12,600 could be where these lines meet and support really holds. That would be at a 5.2% mini-correction from the recent intraday high. We’ll see if the bulls remain timid at that point, but it seems a reasonable area to add a little exposure while we keep some cash reserved if the dip goes towards 10%.
If the selling stops soon and the DJIA rallies over its 50 dma, the next major hurdle will be March’s intraday highs near 13,300. This week coming up includes April’s options expiration Friday. Expect volatility to continue as traders adjust their positions throughout the week.


