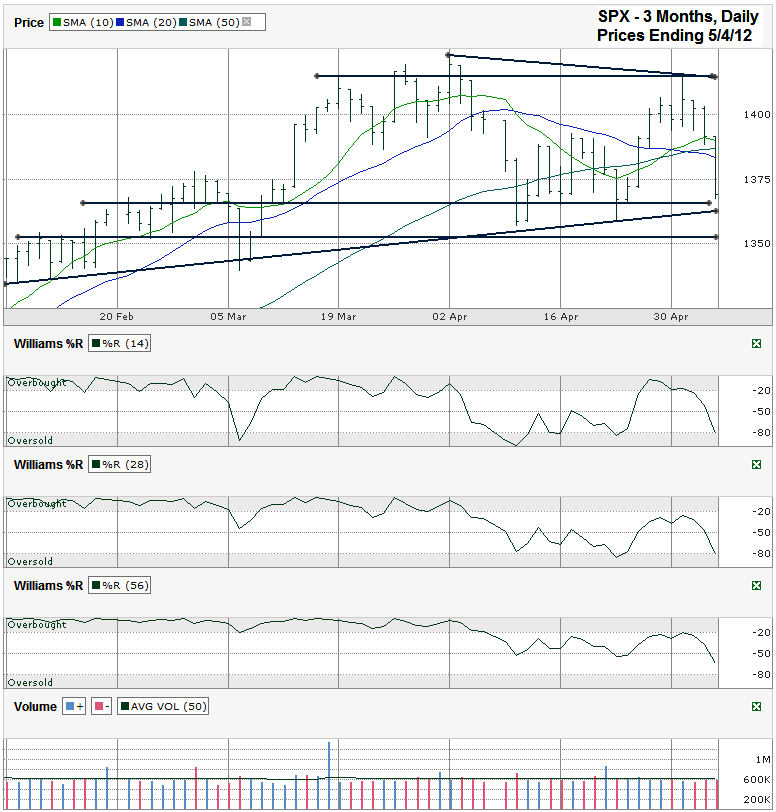
This S&P 500 ($SPX) chart shows the past three months of daily prices after the index finished the week at 1,369.10 on Friday, May 4, 2012.
The technical indicators are not giving as clear of a picture as they often do in foreshadowing what is to come in the near term. This tends to happen when an index or stock is in a consolidation phase and is range bound. Indicators, such as the moving averages and Williams %R can give false readings or roll over before the next trigger comes into play.
The 10 day moving average (dma) moved above the 20 dma early in this past week. This crossover is bullish and typically indicates more positive days are ahead for the bulls. However, within a couple of days, the 20 dma moved below the 50 dma. This is often indicative of the end of a rally and can lead to weeks lower for stocks. The direction for stocks lacks certainty without these three moving averages in agreement.
Williams %R showed a fall below the overbought range in the 14 day indicator by Thursday. This is another bearish signal, but the 28 and 56 day periods had not made it back to the overbought range before stocks rolled over again. This means any dip should be short lived. Large bear markets rarely start without extreme optimism seen within longer time periods.
The lack of clarity from the moving averages and Williams %R leaves the trend lines to tell traders the story. The area of resistance to watch comes from the trend line of lower highs and the horizontal line that is close to multiple intraday highs. Both of these are above 1,410 and give the SPX plenty of room to move higher from Friday’s closing level. The downside is closer to being tested sooner. The large cap index closed within a few points of the trend line of higher lows. Friday’s intraday low is very close to multiple points of support and resistance over the past three months and could mark another turning point. If Friday’s low doesn’t remain as near term support, the next area to watch is close to 1,350, about 20 points or less than 1.4% below Friday’s close. Another 1.5% lower will shake out more of the nervous traders and will bring the S&P 500 to a point where value investors can start picking up stocks that have been dragged down with the masses. This will stop the exodus from stocks and move the index back towards the middle of its trading range where it could stay for another month or longer before breaking to the upside unless a new catalyst surfaces to warrant more selling.


