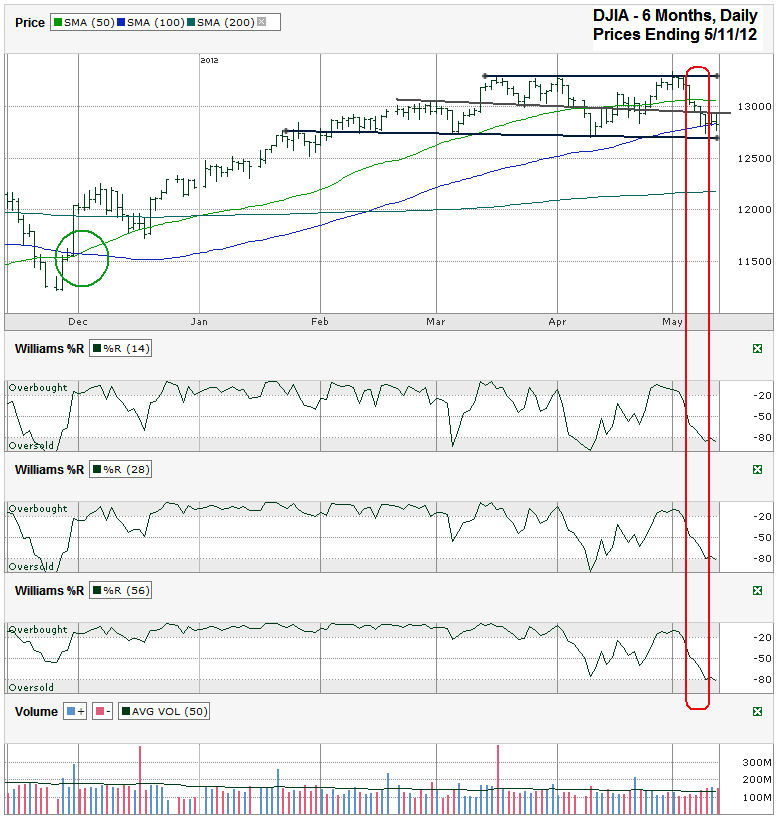
I charted the past six months of daily prices for the Dow Jones Industrial Average ($DJIA, $INDU, $DJI, the Dow) after the index closed at 12,820.60 on Friday, May 11, 2012.
I went back six months on this chart so I could point out where the DJIA had its 50/100 day moving average (dma) bullish crossover at the beginning of December. I pointed out this majorly bullish technical indicator on the S&P 500 on the December 2nd chart. Following that call, the Dow and SPX had nearly four months of bullish trading. The reverse crossover has not happened yet, but the Dow chart has traded below its 50 dma for more than a week and has dipped below its 100 day a few times recently, including Friday’s close that was slightly below it. These are all warning signals, but aren’t necessarily sell signals yet. The true sell signal will come when the crossover actually happens.
The sell signal that I missed (but am not stressed about yet) was from the Williams %R indicator. When it broke below the overbought range I didn’t react right away because I think it tends to give false positives sometimes and needs one or two confirmation days before I generally trade on it. In this case it broke and by the time it got the confirmation days it found support. I might be playing with fire by not adhering to the indicator’s signal, but the 100 dma will be important to watch for real support. In addition, the trend line of slightly lower lows that started in February is still holding support. I’m in the mindset that we’re in a trading range right now and this past week’s intraday lows are just testing the bottom of the trading channel. I’d like to say this is a good buying opportunity, but want to see more than just support. I want to see a bounce before I get bullish too much.
The 10/20 dma crossover (not shown) favored the bulls just a couple of weeks ago, but that ended up being one of those devilish false positives. Now the tables have turned and the 10 and 20 dma are close to having another crossover, but in favor of the bears. If the bears truly gain control for more than half a session, the Dow could fall all of the way down to its 200 dma, around 12,150 now, but edging higher every day. That would be close to a 9% decline from the intraday high seen recently. Unless Europe falls apart quicker and more severely than expected, falling more than a 10% correction is unlikely in the near-term.
The DJIA went through a period like this last summer and fall where my favorite indicators toyed with me. What I learned was that when stuck in a trading channel these shorter-term indicators don’t work as well. Of course the trick is knowing when it’s a trading channel and when it’s an actual change in longer term sentiment. For now, I’m banking on it being a trading channel that will hold support, but I do have a finger on the sell button, just in case the trend line at the bottom fails.
Happy Mothers’ Day!


I do not use the williams indicator, but I am an elliottician. I believe that we are in a wave 4 consolidation, which means to those unfamiliar that we are in a sideways period that will eventually end with price rocketing higher into a new yearly high. The sideways periods are rough, but we trade then and wait for the larger swing trade from the next impulse move.
Matt, It looks like our analysis is in agreement, even though we got there down different roads. We’ll see if we’re both right.