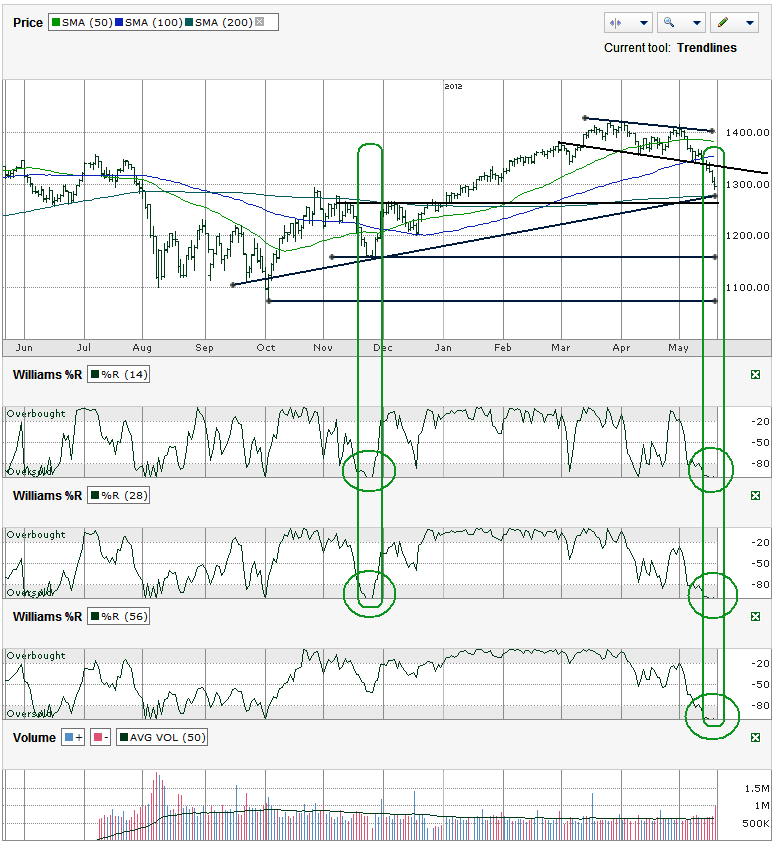
This S&P 500 ($SPX) chart shows the past year of daily prices after the index finished the week at 1,295.22 on Friday, May 18, 2012..
The reason we look at charts is to try to find a pattern in the past that could reflect the direction to come in the future. We’ve all read the disclaimers that read, past performance is not indicative of future results, but we keep looking back anyway. Of course, I believe charts can help predict future results or I wouldn’t be so dependent on charts for my trades. I also realize that indicators might work the majority of the time, but all fail at some point. That’s what keeps the “novice investors” at bay.
Many of the indicators in the current chart are bearish. I didn’t even include the 10 and 20 day moving averages (dma) in this week’s chart, but I can mention they are still showing a bearish signal with the 10 dma below the 20 dma. The shortest trend line of lower highs from March through mid-May broke support last week too. That leaves few trend lines to watch until some potential horizontal support comes back into play. The first of those lines is about 30 SPX points away (2%+) and is just below the 200 dma. The 200 dma is a major moving average to watch. If it breaks and doesn’t find support immediately at the horizontal line shown below, the market could quickly drop another 5-8% as computer models initiate sell orders without another level of support close by. The October and November intraday lows are likely the best areas to expect the computer models to start pumping in new buy orders. The December low would be an 18% correction from March high. A retest of the October intraday low would be a correction of almost 25% and have the market in deep bear territory, but close to average bear market correction levels. Buying in here would be a relatively safe long term investment and buyers should be ready to storm in for above average future returns.
Before those depths can be reached, the SPX has to deal with an anomaly in the Williams %R indicator seen at the end of the week. I always point out that Williams %R is a great indicator to use after a bottom has been reached, not to pick the actual bottom. It’s when the indicator moves out of the oversold (0r overbought) area that the next good trade signal is issued. But is this time different? In late November the 14 and 28 day indicators ran off the page as both time periods hit -100. Within two days the market was on to a new rally. On Thursday the 14, 28 and 56 day periods all hit -100 on the Williams %R indicator. This is the first time I’ve seen all three periods at that level (I only went back a few years to double check). In November it helped to trigger such a strong rally that I started watching for it again. Based on the proximity to the 200 dma, the longer trend line of higher lows and the extreme negative bias in the markets, this could be another signal to buy right now or at least cover shorts.
With the valid reasons for pessimism coming out of Europe, a bounce could be short lived for the S&P 500. At the same time, stock valuations are going to be hard for value investors to ignore for long. The rest of the summer is going to be interesting, but don’t be shocked if stocks do not retest their 2011 lows. Are any investors out there really surprised that Greece’s debt issues are still a concern and will lead to further trouble for the EU? Isn’t a lot of that built into stocks prices? Isn’t that part of the reason the SPX’s P/E multiple is so low when compared to historical levels?


