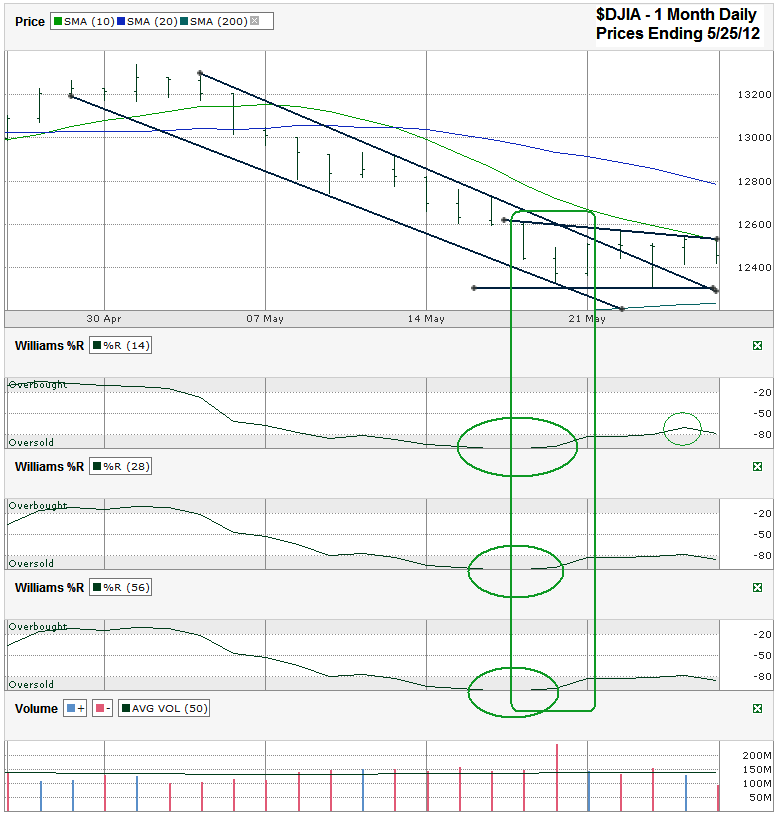
I charted the past one month of daily prices for the Dow Jones Industrial Average ($DJIA, $INDU, $DJI, the Dow) after the index closed at 12,454.83 on Friday, May 25, 2012.
The chart for the past month has enough to offer that I didn’t need to go back any longer. In my $SPX Chart last weekend I called the bounce we just had. I wasn’t sure how far it would go, but the overbought indicator from Williams %R was too much to ignore. What happens now that we’ve had the dead cat bounce?
The lows from the past week have a chance of being retested before the bulls can really take charge (if they can at all this summer). The 10 day moving average (dma) acted as resistance on Thursday and Friday and will be a key indicator to watch. At the same point a trend line of lower highs has formed adding to the resistance. As the Dow moves back to retest the recent lows the 20 dma will have a chance to catch up with the 10 dma. We’ll know with a little more certainty that we’re starting a real recovery more than just a bounce when the 10 dma moves above the 20 dma.
Without a retest of the recent intraday lows, the bulls might be hesitant to pile on new trades, but that doesn’t mean a new rally can’t rise against a “wall of worry” on low volume. Without another catalyst outside of fear and rumors, the bears might not want to sell much more, if they have anything left to sell. Low volume has become a mainstay as retail investors fear taking another bath for a third straight summer. Bears have to fear a victory from the pro-austerity party in Greece and can’t pile it on too badly for fear of a major reversal.
It could be that the Dow came close enough to its 200 dma to be worthy of a new rally starting. The month long trend line of lower highs has already broken resistance. A crack above the 10 dma and the shorter, newer trend line of lower highs mentioned above could be a key signal to buy again. The Williams %R’s move I noted last week called the bounce, but a true renewed rally needs to see %R move out of oversold for the 14, 28 and 56 day periods, preferably for at least three days in a row. Watch for these few points and we’ll know that this pop higher has a better likelihood of being more than a sell on strength move.


