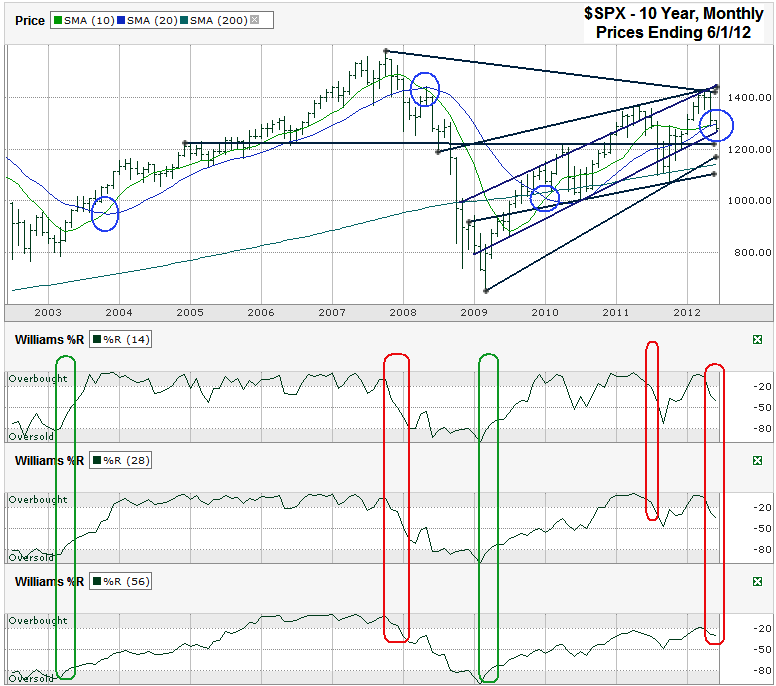
This S&P 500 ($SPX) chart shows the past 10 years of Monthly prices after the index finished the week at 1,278.04 on Friday, June 1, 2012.
The recent SPX correction moved the index into the middle of its ascending trading channel where it found support at a trend line that has worked as support multiple times in the past few years. This trend line is far from flawless and might not be the best indicator to trust after last summer’s breakdown. A more likely opportunity for support could come from a 50% retracement of the 25% rally that started in October 2011. At 1,244, the 50% retracement level is only a percent or two above previous areas of resistance. Resistance often becomes support (and vice versa). This is marked by the horizontal line that started at the end of 2004.
The bears will turn to other indicators to point out what favors their gloomy predictions. The 10 and 20 month moving averages have been excellent forecasters of what is to come. On the previous three crossovers during the past decade (and the two from the prior 10 years not shown here), each occurrence foreshadowed multi-month trends. The bulls rule the markets when the 10 month line moves above the 20 month line and the reverse is true for the bears’ opportunity to take control. The 10 month moving average is converging with the 20 month moving average as May ends and June begins. If stocks rally soon then the full crossover will be avoided. If not, this indicator will favor the bears.
The Williams %R indicator tends to send out its signals of long term sentiment shifts prior to each of these crossover events and is more dependable when longer time period breaks coincide with the 14 month indicator. Although the 56 month indicator failed to make the move completely into the overbought portion, it has fallen away from overbought along with the 14 and 28 month periods. This does not bode well for the bulls, but as 2011 proved, these sentiment shifts can play out over just a few months.
Caution should be the plan for most investors this summer. The rally that follows this correction (and possible bear market) will be sharp when momentum shifts back in favor of the bulls. Shorting the market at this point is extremely dangerous. It might take a macro-economic event as a catalyst for change or it could be a touch on the 200 month moving average, which happens to be close to the bottom of the ascending trading channel mentioned above. Whatever the trigger, stocks will turn higher and those with a long enough time horizon will be rewarded.


