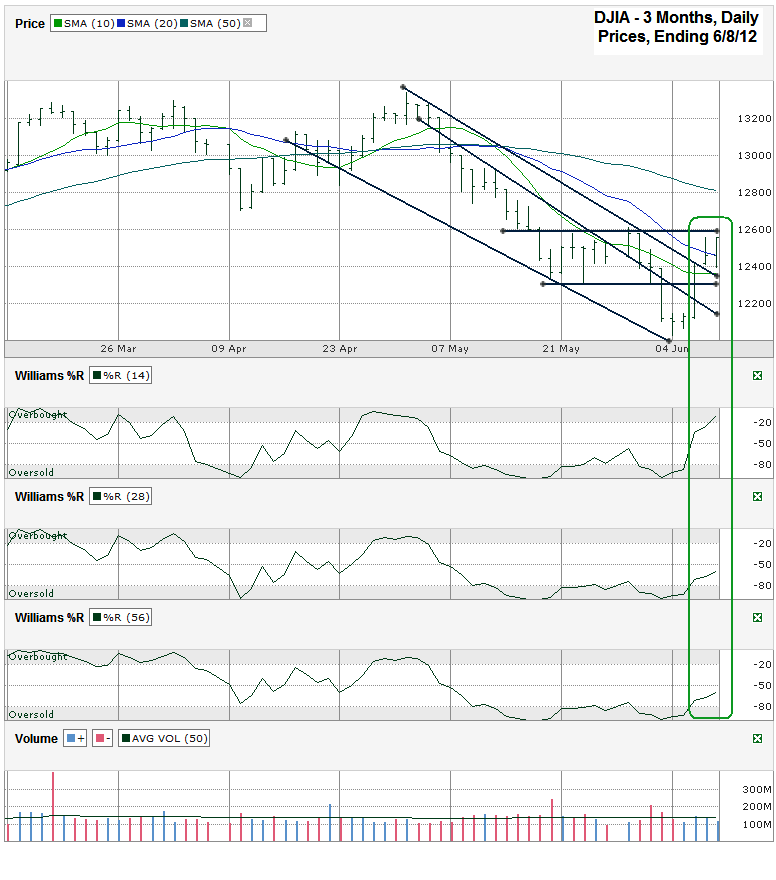
I charted the past three months of daily prices for the Dow Jones Industrial Average ($DJIA, $INDU, $DJI, the Dow) after the index closed at 12,554.20 on Friday, June 8, 2012.
After sliding steadily for a few weeks, the Dow finally broke above its trend lines of lower highs and is either in a consolidation period or is on the verge of another break out. Either way, the downside risk seems to have subsided for now. During a consolidation period it won’t be strange to see a retest of the early June lows before a truly trustworthy rally can begin. That might work in favor of the bulls as the “wall of worry” prevents too many investors from jumping aboard the buy side. The gains still count even if volume isn’t heavy.
The first big test for the index will be around the 12,600 level. This was support briefly on the way down and then has been resistance ever since. The DJIA couldn’t even get all of the way up to this point in the past two days as the 12,555 level proved to be a hard ceiling. A failure to move above this barrier will be a good excuse to sell for many technicians. When this resistance is broken it will coincide with a 10 day moving average (dma) moving above the 20 dma which is a very strong bullish signal.
An early indication of better days ahead is foreshadowed in the Williams %R indicator which moved out of the oversold range for the 14, 28 and 56 day periods. Each of these periods has also seen confirmation days which are key to showing strength. If the DJIA does move above 12, 600, the trip could be short lived as the 50 dma is moving lower and could offer further resistance around 12,800, only 2% above Friday’s close. A move above 12,800 could take the Dow well into the 13,000s.
Waiting for each technical level to give the “all clear” signal will cause investors to miss gains along the way, but could save some frustration for buying in at a near term high. At the same time, taking on some additional risk with limited downside from these levels could have a nice payoff.


