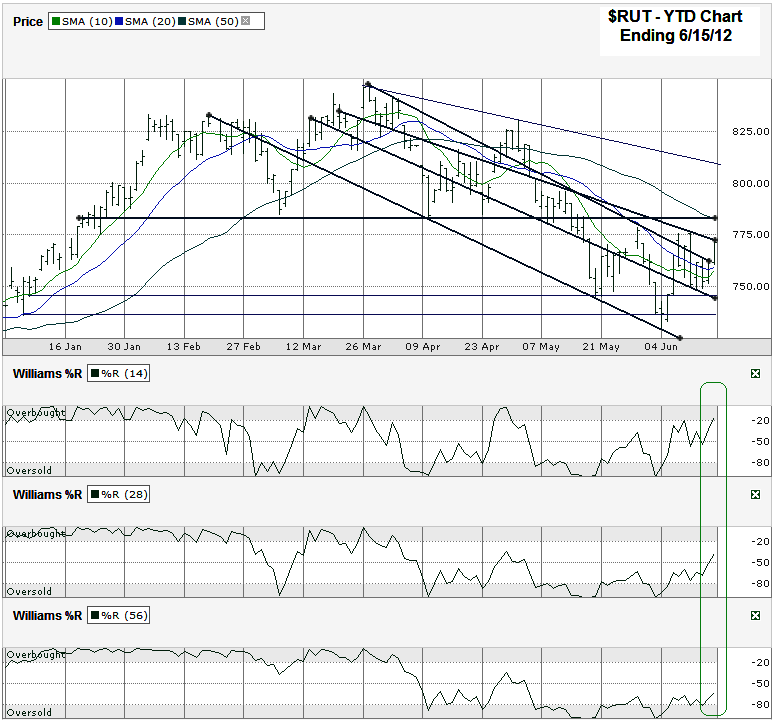
I charted the year to date daily prices for the Russell 2000 Chart ($RUT) after the index closed at 771.32 on Friday, June 15, 2012.
So many trend lines, so little space. Hopefully I didn’t make this chart too crowded, but there’s a lot going on in it. For the most part the trend lines are pointing lower. Both the lows and the highs have gotten lower since the March peak. The small cap ETF reached the upper trend line of lower highs on Friday and is facing major resistance after moving above previous resistance levels with barely a pause. Even if the current descending ceiling does not last as resistance, the next horizontal line of resistance could be too much for the RUT to handle. This horizontal line, around 783+-, is only about 1.5% higher than Friday’s close and marks previous areas of support and then resistance this year. This is going to be the biggest indicator to watch in the coming days, not just for its previous notability, but also because the 50 day moving average (dma) is sitting there right now.
What makes this chart so interesting right now is not just the multitude of descending trend lines breaking resistance every few days, but also the trade signals coming from the 10 and 20 dma and Williams %R. The 10 dma is about to have a bullish crossover with the 20 dma. This tends to be a bullish indicator the majority of times it occurs. It happened in late April and was a false positive which proves it isn’t flawless, but also sets it up as an unlikely chance for a repeat disappointment. In addition, the Williams %R indicator broke above the oversold range a couple of weeks ago, slipped some and then renewed its ascent again over the past couple of days. This shows a confirmation of the momentum shift and tends to indicate better days are ahead for the bulls still.
As much as I like the bullish moving average crossovers and Williams %R shifts, it still could be worth waiting for the 50 dma to play out its potential resistance. Since the demarcation line is so close to the current level, the wait for more clarity will be short. A move above this 783-785 area should take the index another few percent higher before the next test comes into play with another descending trend line of lower highs. After that, 825 and 847 are going to be the next targets. If resistance holds below 785, look for a retest of 750 at a minimum.
Happy Father’s Day to all the dads out there. Enjoy your day!


