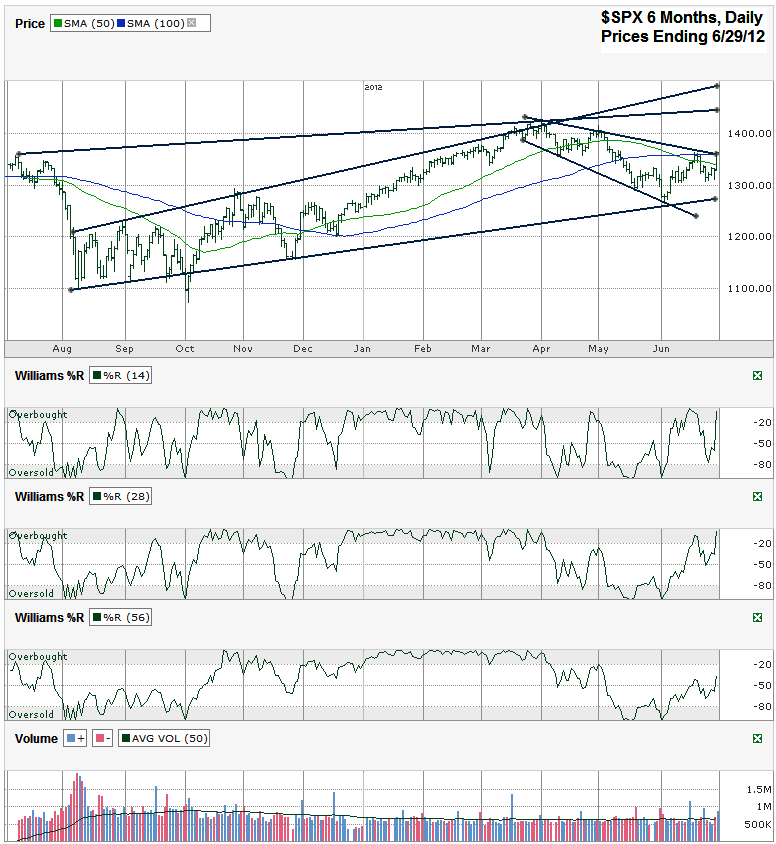
This S&P 500 ($SPX) chart shows the past six months of daily prices after the index finished the week at 1,362.16 on Friday, June 29, 2012.
June was a strong month for the S&P 500 as it bounced off its lows met on the first couple of days of trading. That bounce took the large cap index up to its 50 day moving average (dma) where it failed to break above resistance. This came just a few days after the 100 dma moved below the 50 dma. This moving average crossover is often a bearish signal, just as the opposite is bullish as I pointed out in early December. The trend that follows tends to be lower, but as proven by the December price action for stocks and this past week’s positive gains, this is a longer trend and doesn’t kick off on the day (or even week) of the crossover. The indicator is worth watching and is another reminder not to get overly bullish quite yet.
On the bulls’ side, the shorter term indicators such as the 10/20 dma crossover (not shown) turned positive for stocks upside potential recently. In addition, the Williams %R indicator made a positive launch from oversold early in the month, faltered briefly in the 14 and 28 day periods and then recovered again. As volatile as the markets have been recently, the Williams %R indicator has been less reliable on the shorter periods, but more reliable using the 56 day period. Still, with resistance facing the SPX at the 50 dma again now and the bearish 50/100 dma crossover at hand, watching the 14 and 28 day %R indicators could save some ill-timed trades.
Based on how the SPX has traded recently, it appears there is more upside room than downside risk in the near term. Just looking at the longer trend lines shows the index is trading closer to its trend line of higher lows than its longer two trend lines of higher highs, although Friday’s bounce moved it much closer to the middle of this trading channel. However, the shorter trend lines tell a different story. When only watching the past three months, the SPX looks like it is facing tough resistance from its trend line of lower highs and could get pushed back towards its trend line of lower lows or at least back to the longer trend line of higher lows mentioned a few above.
In short, this chart has a lot to offer for both bulls and bears, but the next couple of trading days should clarify which side pulls ahead pretty quickly. Once resistance breaks, it will often turn into support and the downside risk diminishes even more. This could quickly turn into a fun rest of the year, although this might be a little early still for the fireworks.


