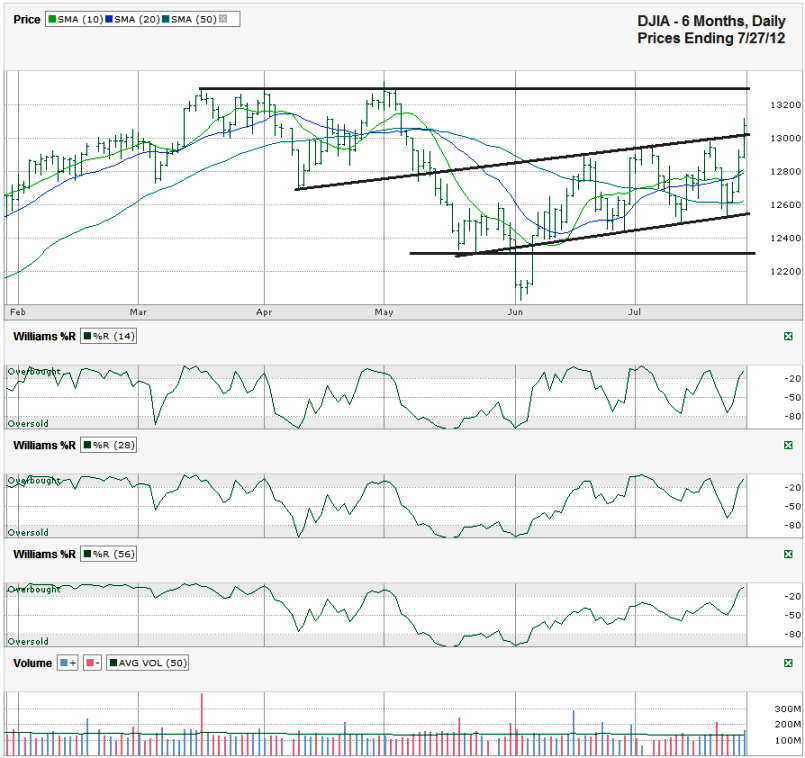
I charted the past six months of daily prices for the Dow Jones Industrial Average ($DJIA, $INDU, $DJI, the Dow) after the index closed at 13,075.66 on Friday, July 27, 2012.
The DJIA fell below support at the beginning of June, but bounced back quickly and created a new ascending trading channel. The price action of the index’s stocks pushed it back down to the bottom of that range at the beginning of this past week, but stocks didn’t roll over. Instead, the collection of large cap stocks shot back to the top and even overshot the line of previous resistance. Often a move above an ascending line of higher lows can mean too much exuberance came into the market (maybe short covering) and the run can be short lived. That’s not always the case, but should give traders a reason to pause their buying until the dust settles a little.
The next line of resistance from the spring’s intraday highs is less than 200 points away. That’s not far and leaves more room to the downside than the upside in the very near term. Of course, any true move from the Fed or other countries’ monetary leaders could be a real cause for broad based buying. The talk was enough to get us this far, actual policy should do much more.
The 10 day moving average (dma) almost crossed below the 20 dma, but stayed to the bullish side on this week’s rally. Both are still above the 50 dma which indicates more positive days are ahead for the market. The Williams %R indicator is in agreement with the moving averages. It fell below overbought which issued a sell signal, but without the moving averages 2nd of the trade signal I didn’t sell any of my long positions.
With resistance close by and a sharp two days of rally in the books, this week is going to be telling. Hold on to your long positions, but be ready to pocket some gains if needed if resistance works again around 13,250.


