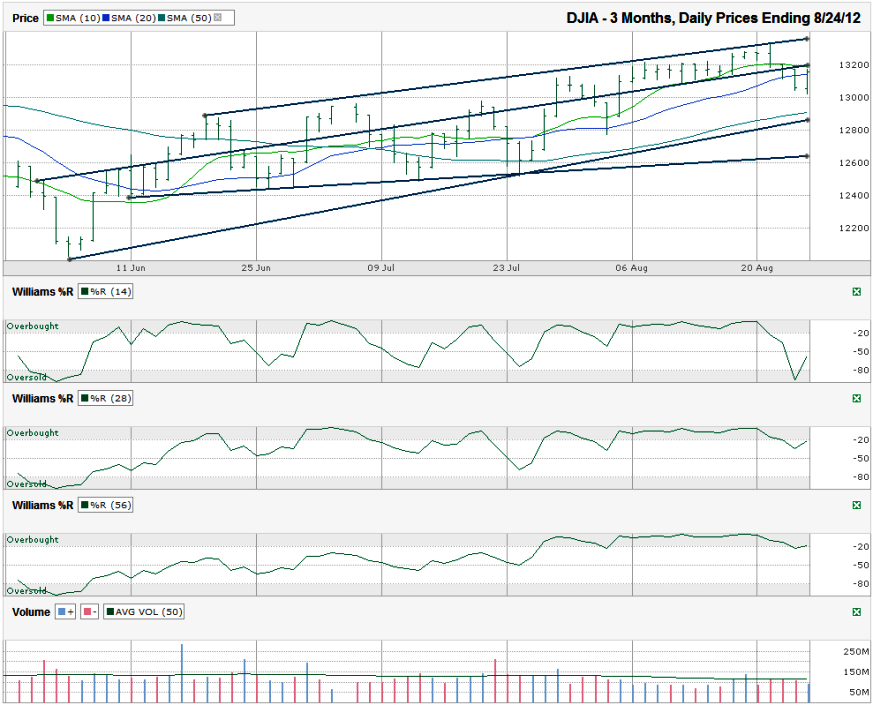
I charted the past three months of daily prices for the Dow Jones Industrial Average ($DJIA, $INDU, $DJI, the Dow) after the index closed at 13,157.97 on Friday, August 24, 2012.
The Dow rode along its trend line of higher highs for a couple of weeks, but appears to be slipping now. The short trend line of higher lows broke support from its narrow range and is now acting as resistance, just as the 10 day moving average (dma) is. The 20 dma only held support for a single day before becoming another blip on the chart. In the final two days of the week, the 10 dma held resistance and the index moved on both sides of the 20 dma as it’s tried to keep from falling further.
The 10 dma has stayed above the 20 dma since the bullish crossover occurred in mid-June. Since then, the DJIA has crawled higher on relatively low volume. If it doesn’t move above the 10 dma by Wednesday, we should see the reverse crossover with the 10 dma below the 20 dma which is an indicator that further losses are coming.
The depth of the losses might not be too bad. The next area of potential support is close by with the 50 dma. It might not do much more than the 20 dma did last week in stalling the decline, but is worth watching. However, just below that, and ascending, is the trend line of higher lows that has marked the lows of the summer. It’s gaining ground quickly and might be enough of a dip to bring the buyers back into action. The more tested trend line of higher lows is only slightly shorter and is not ascending as quickly. The less aggressive rise in prices could be a more reasonable trajectory and would give the Dow Jones a 5% mini-correction. This would mark the biggest decline in months and has a strong possibility of holding off further selling.
If the DJIA is going to fall any deeper than Friday’s close, the Williams %R indicator should throw out another red flag. Chartists can see where the green line moved below overbought on the 14 and 28 day indicators which signals a change in sentiment. As quickly as it fell, the 14 day period hit a bottom and rebounded out of oversold. It’s too early to tell if this is a dead cat bounce within the indicator or if the momentum has already shifted back in favor of the bulls. The 28 day indicator didn’t get low enough to mean much on its reversal and the 56 day indicator hasn’t shown that the move lower is more than a random dip rather than a true change in direction.
If the momentum changes back in the bulls’ favor, 13,400 appears to be a ceiling for stocks at the trend line of higher highs, but if this is the beginning of a further decline, a dip to 12,650+- would not be surprising at all. A fall below 12,500-12,600 would be a bigger surprise and worth selling into as something bigger must be in play by then.


