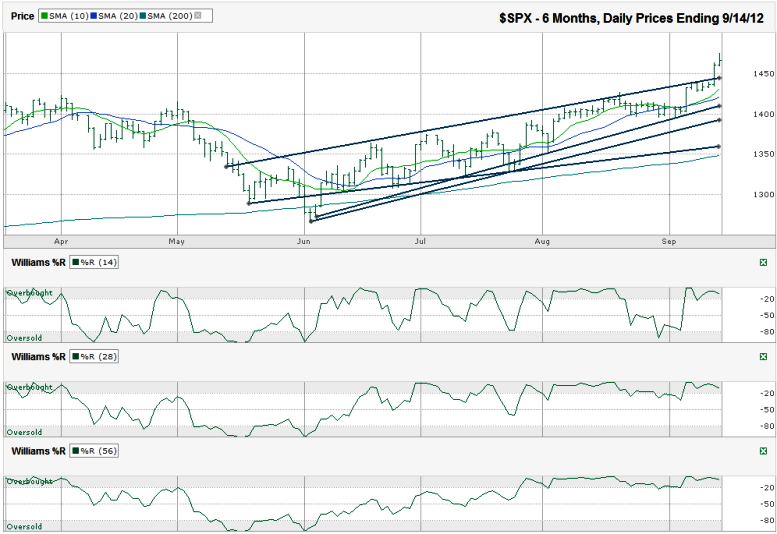
This S&P 500 ($SPX) chart shows the past six months of daily prices after the index finished the week at 1,465.77 on Friday, September 14, 2012.
The upside limit is unclear since the SPX is at multi-year highs now and doesn’t have clear hurdles in front of it. With the power of easy money as a tail wind, investors could see another 100 points to the upside, maybe 5-7% higher very soon. From there, a 7-10% correction should be expected. The new near-term area of support should come from the trend line that was resistance. This line has a high probability of becoming support. The 10 dma will pass above this line soon and offer additional support. Once that line breaks, traders could be ready for the bears to have their turn again and the 200 dma could be a new target. Currently, that’s not quite 8% lower than Friday’s close. This moving average will move higher at a slower pace than the index itself. That’s how a full 10% correction could come into play as the gap widens. The lowest trend line of higher lows could come into play again by then too, but that event is too far down the calendar to know for sure.The trend line of higher highs that marked resistance for months broke on Thursday with the Fed’s announcement of QE3. A few days before that, the 10 day moving average (dma) converged with the 20 dma and the index was on the verge of starting a correction. Instead, the 10 dma’s move back above the 20 dma signaled a renewed reason to buy. However, most traders waited for the fed with resistance so close. Once the good news was out, the buying spree was free to run along with a heavy dose of short covering to make the rally charge into the weekend.
Williams %R is back into the comfort of the overbought range and will remain a good early indicator for bigger declines. For now, the bulls have complete control outside of inconsequential 1-2% intraday drops. Even with solid one to two day losses, the bull trend is still in place. Don’t be too quick to panic, but understand this won’t last forever.

