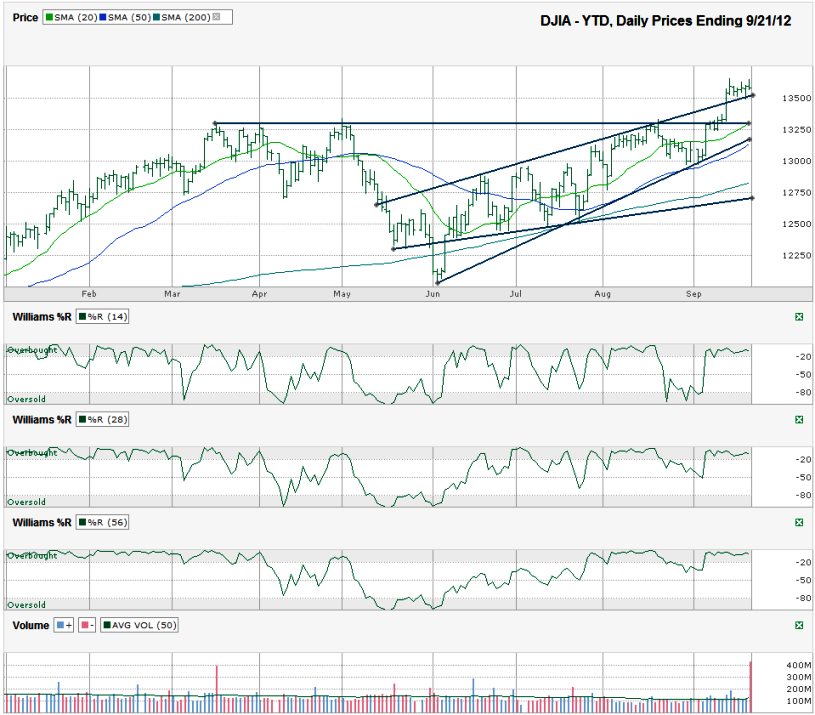
I charted the daily prices for the year to date on the Dow Jones Industrial Average ($DJIA, $INDU, $DJI, the Dow) after the index closed at 13,579.47 on Friday, September 21, 2012.
The Dow is only about 5% above its 200 day moving average (dma). That is relatively close still compared to other peaks such as 2007 when it was much closer to 50% higher. Even in the spring of this year, the difference was more than 9%. This has been a long consolidation period and with the 200 dma staying within a mini-correction’s distance from the index, any downside should be somewhat limited. Until the fundamentals change, it’s unlikely to see the DJIA fall below its 200 dma and very unlikely to see it fall more than 5% below it. In this worst case scenario, that would only be a 10% correction and should reset the mood of the bulls again to have a reason to buy on value.The DJIA broke through previous resistance the prior week after the Fed’s QE3 announcement and has flattened out enough to use that same trend line as a new line of support. The upside doesn’t have a clear new hurdle nearby yet, but that doesn’t mean large cap stocks are going to go for another big run yet. The fears of how the election and the fiscal cliff could change the economy might hinder the speed of the ascent.
The 20 dma is still in a bullish pattern above the 50 dma. These trends tend to last for months. So far, it’s been less than three months and doesn’t show a sign of changing soon. Keep an eye on these two moving averages to know when to jump ship. It won’t be an early indicator, but should be a worth more than a few percentage points saved in losses.
The Williams %R indicator issues earlier indications of changing sentiment. For now, the 14, 28 and 56 day periods all show the bullish trend is still intact. Watch for the break below the overbought area along with at least two confirmation days to foreshadow more days of loss coming. Until then, invest carefully, but don’t be too quick to turn bearish.

