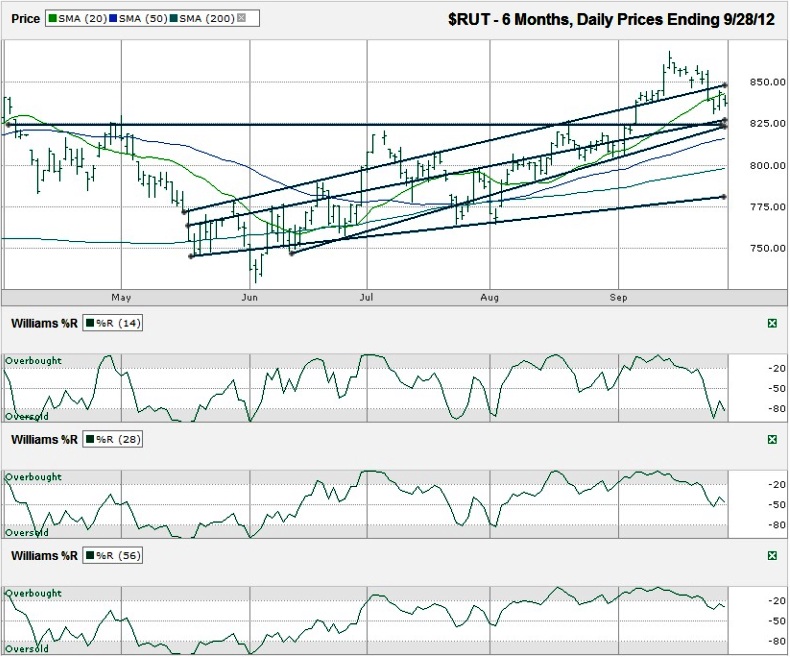
I charted the daily prices for the past six months on the Russell 2000 ($RUT) after the index closed at 837.45 on Friday, September 29, 2012.
Two other trend lines are set to converge just above the 825 area. If support works here, it would mean RUT fell 5%. That’s a descent enough drop to shake out some of the weaker players and help small caps continue to climb the “wall of worry”. The 20 dma isn’t too far below this area and is rising quickly. That’s the third point of support around the 5% mini-correction level.In the first week of September, the Russell 2000 moved above its long trend line of higher highs and then rode this line as support. That changed last week when support broke and traders saw a quick decline below this trend line and also below the 10 day moving average (dma). Each of these breaks send up a warning flag, but not necessarily a sell sign yet. The 10 dma has acted like it has a gravitational pull and has kept the small caps from sinking further. This could be a brief consolidation before further weakness surfaces or enough of a break to bring the bulls back into play.
If these lines in the sand don’t hold up for the bulls, the bears could push the small cap index down to the 200 dma, close to 800 or even the lowest trend line of higher lows, closer to 780. The former would be almost 8% below the intraday high and 4.5% below Friday’s close. The later would be a full 10% correction, almost 7% below Friday’s close. I don’t see it getting much worse from there, but the bulls often get a second wind after the 200 dma breaks support.
The decision to buy or sell could be made right here, but might be better after 825 shows its strength or lack thereof. The Williams %R indicator has already said get out now. That shows it’s dangerous to open any new bullish positions in the near-term. Traders might be better to take off some exposure before it gets worse. Mondays have continued their streak of losses, so don’t panic on Monday. Tuesday will be the true test and if traders see prices falling further, it will only get worse for the bulls.
I’d be remiss without mentioning upside targets. The Street hasn’t been focused on upside as much over the past two weeks, but when it turns again, the mid-September intraday high, at 868.50, will be the first hurdle after crossing back above the 10 dma.

