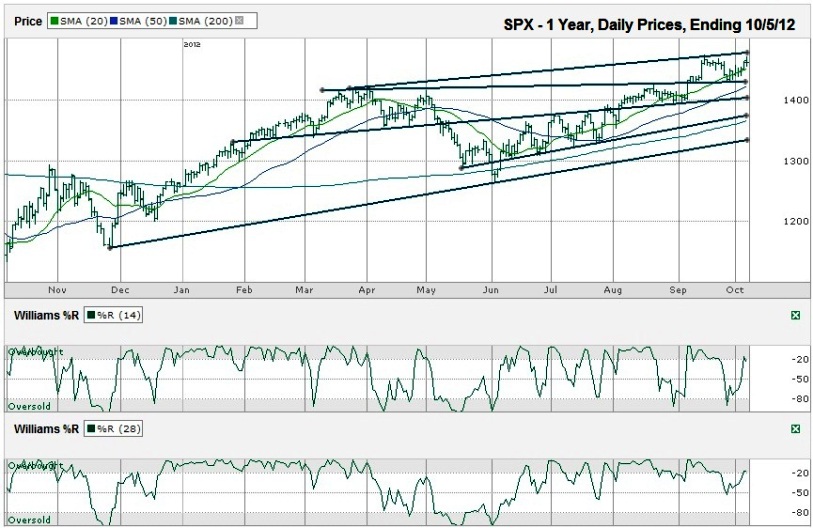
This S&P 500 ($SPX) chart shows the past year of daily prices after the index finished the week at 1,460.93 on Friday, October 5, 2012.
Traders can see momentum shifts has occurred when the 20 and 50 day moving averages (dma) crossover on this SPX chart. The exact bottoms and tops of each cycle are not foreshadowed, but the majority of the trends are signaled early, allowing traders to capture most of the swings. The 20 dma moved above the 50 dma on this chart in early July. The index tested the 50 dma at the end of July, but has not been close to it again since then. While every move below the 20 dma should be watched, it is the crossover that matters for these long trends. Like every technical indicator, it is prone to giving false readings occasionally. That is where the art of reading a chart factors in.Market trends are often foreshadowed in part by their moving averages. As stocks trade above their moving averages they tend to move higher. When momentum shifts and prices begin to fall, stocks fall below these moving averages. The longer a trend maintains the same trajectory, the more of its shorter-term moving averages move above its longer-term moving averages. Buy signals can be seen when a shorter moving average moves above a longer moving average and vice-versa. The same holds true for most indexes.
Following trend lines is one of the arts a technical trader needs to understand. In this chart, the SPX is closer to its trend line of higher highs than it is to its trend line of higher lows. That gives more room to the downside for the index to move if it is to continue through its current channel. In addition, resistance is often seen at horizontal levels of previous highs. The S&P 500 is facing resistance around 1,475, close to the intraday high from September. A break above this resistance would normally bring in more buyers quickly, but the trend line of higher highs is close enough to slow the flood of buy orders. These will be key lines to watch in the coming weeks.
Another seemingly easy indicator to read is the Williams %R indicator, but the variables that factor into a trade signal are not as simple. A move below the overbought (-20) and oversold (-80) is usually a signal for a trade. Experienced traders have learned to wait for two to three confirmation days to reduce the number of false readings from this indicator. The art using this tool comes from choosing the correct time period that works well for each stock or index. Also, every move above and below these levels cannot be viewed in a vacuum. In this chart, the 28 day period did not break below the overbought period enough in August to signal a sell order even though the 14 day period did. Recently, the 14 day period broke support again and the 28 day period came with it, but reversed quickly. This was enough of an action to cause doubt in the strength of the bull market from current levels.
Active traders could consider using options to hedge their long positions or entering trailing stops to protect themselves from outsized losses. If the market does correct soon, it could fall all of the way back down to its 200 dma, which is close to a trend line of higher lows, near 1,365. That would be more than a 7% correction from the recent intraday high.

