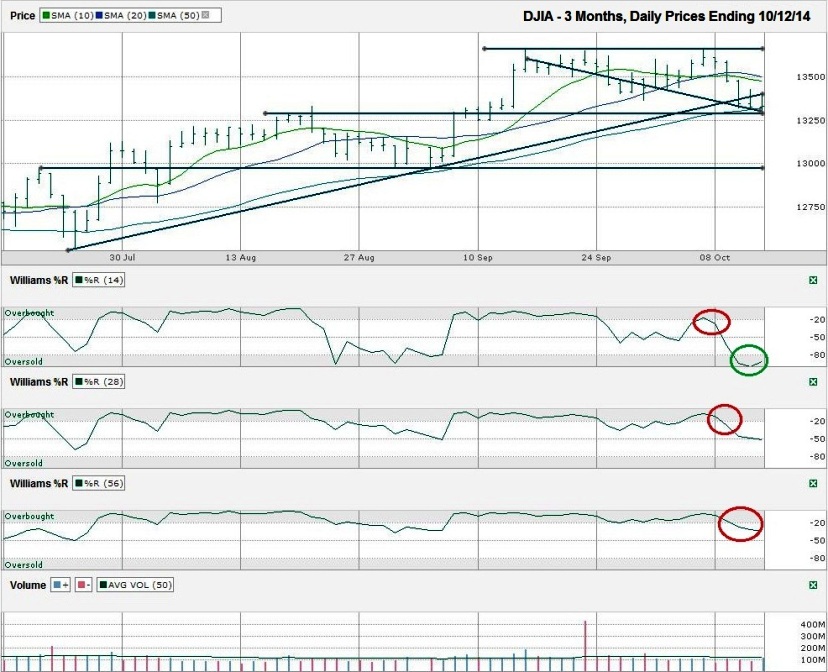
I charted the daily prices for the year to date on the Dow Jones Industrial Average ($DJIA, $INDU, $DJI, the Dow) after the index closed at 13,328.85 on Friday, October 12, 2012.
At the beginning of this past week, the 10 day moving average (dma) crossed below the 20 dma. This is usually an early indicator of bigger losses on the horizon. So far, that has held true. Also, the trend line of higher lows that has lasted most of the past three months broke support on Wednesday. The Dow didn’t close above this line in the following two days. This same line could end up as resistance for future rallies. Adding to the list of red flags, the 50 dma broke support on Friday. The Dow recovered to close above it barely, but it sent a good warning signal. Not to be left out, the old faithful Williams %R indicator has shown a reversal of momentum in all three time periods I use, 14, 28 and 56 day. Even the 56 day indicator has had confirmation days that favor the bears.The Dow Jones has been in a sideways trading pattern since mid-September, but the chart shows the price range was set a month earlier. What was resistance, has become support, as it often does. However, Thursday and Friday’s trading was the first real tests of this potential area of support and the large cap index has a few technical indicators not going in its favor.
Clearly, the bears had the lead through last week, but the bulls have one last stand they need to make. After breaking through the 50 dma, the bulls pushed large cap stocks higher into the close. This 50 dma is a crucial line to watch for which side takes control for the next 300 points. In addition, the same area marks the bottom of the trading channel mentioned at the top of this analysis. If the Dow falls below 13,250, the next 250 points could be lost the following day. A close below 13,000 could mean another 250 point drop quickly too.
That’s the doom and gloom outlook, but Thursday saw the 14 day Williams %R indicator hit an extreme, below -99. These extremes have been known to foreshadow a bottom a couple of days later. It happens more often when more than the 14 day indicator hits it, but it deserves an eye on it. If stocks bounce from their current levels, they’ll have to fight back through the 10 and 20 dma before facing previous horizontal resistance. The bulls might think they have a chance at breaking through resistance on the next run higher. The same horizontal line has been tested twice since the Dow’s first visit up there. A fourth test tends to be a winning move for the bulls. Be forewarned, the streak of losing Mondays continues and Monday’s price action could be difficult to read. Tuesday will be more definitive.


