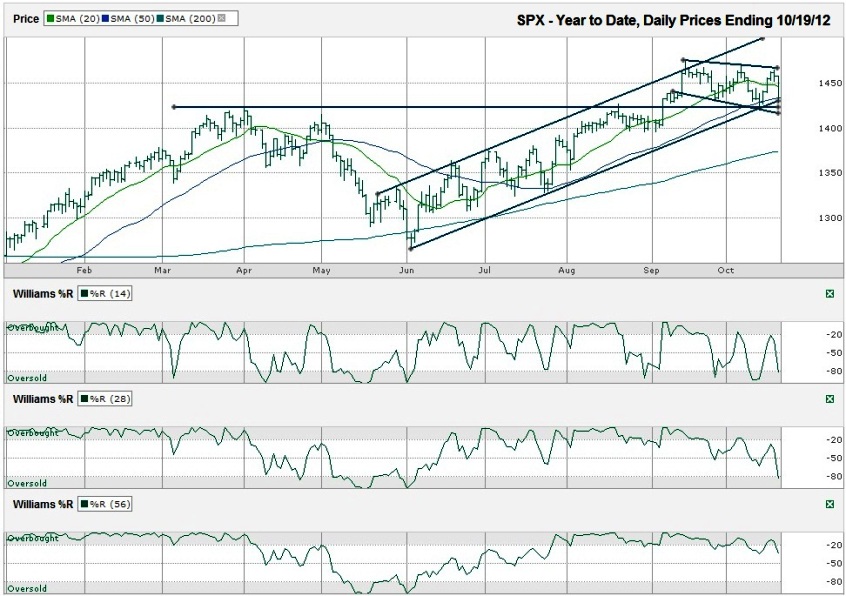
This S&P 500 ($SPX) chart shows the year to date daily prices after the index finished the week at 1,433.19 on Friday, October 19, 2012.
The 10 day moving average (dma) isn’t shown here since I pulled the chart too far out to keep it from blending in with everything else. I can tell you, the 10 dma is still trading below the 20 dma. That’s bearish. The 20 dma broke support again and the SPX closed below it. The 50 dma broke intraday also and then the index closed almost right on this longer moving average. If the 50 dma breaks support and the long trend line of higher lows doesn’t hold, the SPX could be headed down to its 200 dma, around 1,375. This would be a correction of approximately 100 points from its intraday high seen on September 14th, less than 7%. 42 of those points are already lost. So, from Friday’s close, the S&P 500 might fall another 4% before having a new technical reason to stop descending. As “luck” would have it, this is very close to the 50% retracement level from the June low to the September high.The chart shows a long term trading channel still intact that has been moving higher since the beginning of June, but a short term trading channel that is descending since mid-September. Both of these trading channels cannot last for much longer. SPX could move higher and stay in both for few more days, but not much longer. The index finished the week close to both trend lines that mark the lows. It could be the longer trading channel is over and the new trajectory is lower. That’s not clear yet.
The Williams %R indicator has started to signal lower days ahead too, but hasn’t completely given the bulls a call to thrown in the towel yet. The 14 and 28 day periods didn’t quite make it into overbought territory. Both have fallen from their peaks, but only for two days. Another confirmation day would be helpful to establish the trend. However, without both of these reaching extreme overbought ranges on their recent rallies, the sell-off might not be overly severe. The 56 day indicator did reach overbought and had its first day below this range on Friday. It could use two more confirmation days before its signal is clear. A lot of ground can be lost before then.
Together, these indicators do not scream out a reason for panic yet, but do issue some calls for caution. The upside isn’t much beyond Friday’s opening levels and the downside might only be another few percent. One side will break out and that’s when a clear buy or sell signal will bring in much higher volume. To save from losing slowly on a drift lower, watch the trend line of higher lows from June and the 50 dma to see if they break. Closes below both of these with confirmation days will give the bears reason to pile it on.

