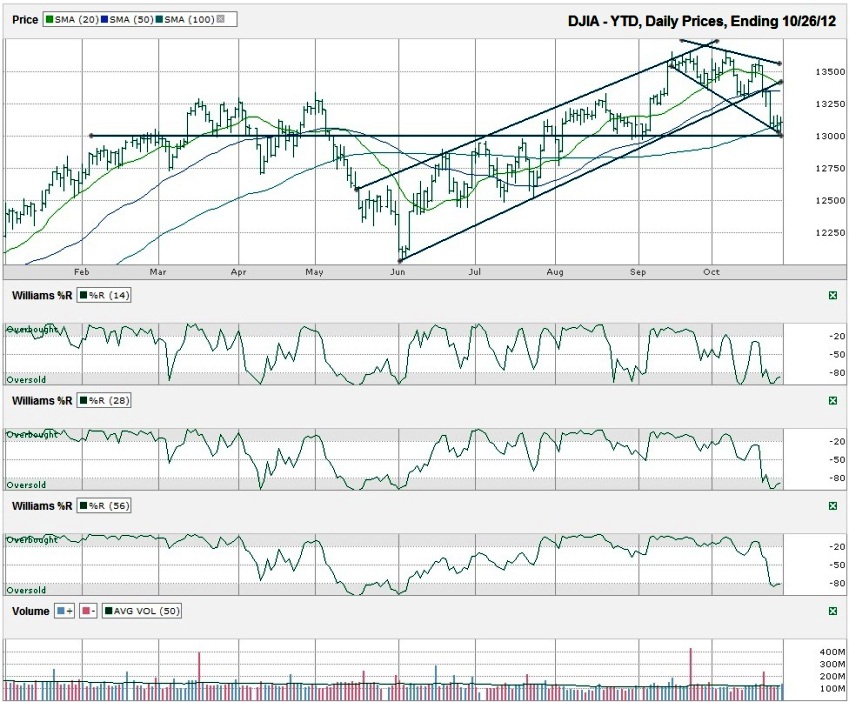
I charted the daily prices for the year to date on the Dow Jones Industrial Average ($DJIA, $INDU, $DJI, the Dow) after the index closed at 13,107.21 on Friday, October 26, 2012.
The 13,000 line has acted as support and resistance multiple times this year, but is not a solid barrier to continued momentum in either direction. Still, 13,000 bears watching, because others are watching it and automated sell triggers could be initiated if/when the INDU crosses below it. Adding to the potential breakdown, the 100 day moving average (dma) has broken support in the past three days, but the bulls have been able to pull the index above it by the day’s end each time. Just crossing the moving average mid-day sends up a red flag. Cautious investors will keep an eye on this line for a close below it. A close below this ascending target could give the bulls more reason to back off and the following day could be much worse.The INDU chart doesn’t always give a clear indication of where it is heading, but we can take some hints from a few indicators to find key levels to watch. Round numbers that end in 000 tend to fascinate traders, but really have no true significance. They are just easier to remember. However, since a lot of traders watch these numbers, they become important for being easily visible, kind of like a reality TV “star” becomes famous for being on TV.
The Dow is hugging its descending trend line of lower lows. It’s unlikely this line will break support since it is already fairly steep. The best case for the bulls would be to see a bounce all of the way back up towards 13,500 where the trend line of lower highs is. The worst case would be a continued slide lower with occasional sideways days that only give more room to the downside.
If 13,000 doesn’t hold support, the next horizontal line (not shown) to downside is around 12,500 and then 12,000. From there, it could get really ugly for the bulls. The 50 dma is still above the 100 dma, but keep a close watch on these two moving averages. A shift for the 50 dma below the 100 dma is a solid indicator of multiple weeks, if not months of weakness ahead. That crossover isn’t here yet, but the 50 dma is rounding off its top and will start descending towards the 100 dma if the INDU doesn’t move higher soon.
Upside movement could take a pause at 13,500 before pushing towards new highs. The past few days of consolidation above 13,000 could be a base forming, but it’s too early to tell. Traders should wait for Williams %R to make a multiple day move above -80 for a safer entry point.


