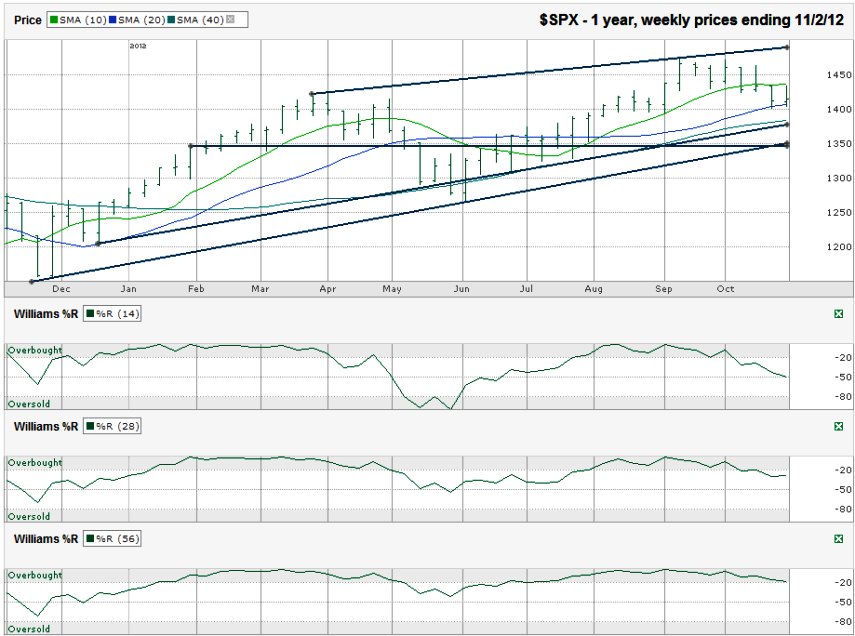
This S&P 500 ($SPX) chart shows the past 12 months of weekly prices after the index finished the week at 1,414.20 on Friday, November 2, 2012.
The Williams %R indicator sent out warning signals in October and hasn’t reversed yet. The 14 week indicator continues to flow downhill, while the 28 week indicator is ebbing a little. The 56 week indicator still hasn’t issued its sell signal, but is inching closer. Clearly, momentum has shifted and this is not the time to get bullish yet for those who are risk averse. Anyone who has a longer time horizon might not do so poorly by selling out of the money puts to capture some of the growing fear and buy in at lower prices. When the markets turn back in favor of the bulls, 1,500 will be a target to track towards quickly.Sometimes a chart is set up in a pattern that makes your next trade easy. Other times, the chart isn’t so nice and pretty. The chart for the SPX over the past year shows an index still in its ascending trading channel, but losing steam in the near-term. For four weeks in a row, the SPX has closed below its 10 week moving average (wma). After the second weekly close below the 10 wma, the bulls couldn’t hold on and it dropped down to the 20 wma where support came through for the next two weeks, but only after a slight break intra-week. The closing level matters, but the intra-week swings create warning signals too. The 40 wma is still 25 points below Friday’s close and is in line with a long trend line of higher lows. This will be the next key line to watch for a bull/bear stand-off. That’s if the 20 wma doesn’t hold. Below that, I drew a trend line of higher lows that does not ignore the lowest points of extreme lows for the SPX. This line marks what could be a secondary area of support for a short time if the 1,390 area doesn’t hold. The 1,350 range should only be a touch point for the index to bounce off of. Any continued lingering around this level might be an indication that further weakness is on the way.

