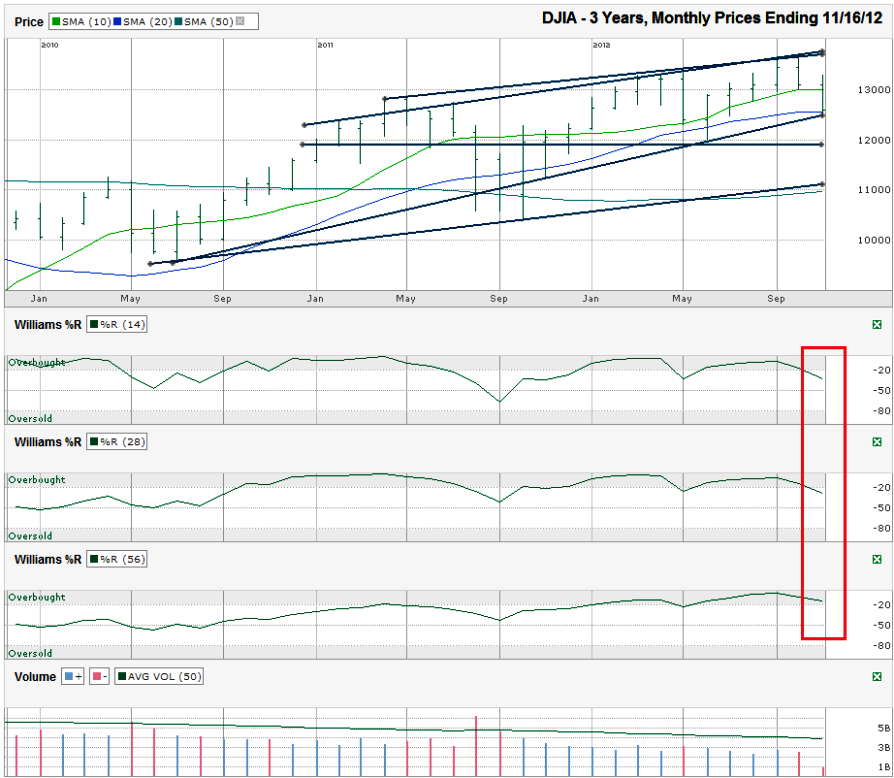
I charted the monthly prices for the past three years on the Dow Jones Industrial Average ($DJIA, $INDU, $DJI, the Dow) after the index closed at 12,588.31 on Friday, November 16, 2012.
A few key indicators stick out on this chart that might help technicians with longer-term planning. The DJIA broke through its 10 month moving average (mma) this month after using it as support for three months in a row. It’s sitting on its 20 mma now. If the 20 mma breaks support, we could see a free-fall towards its 50 mma around 11,000.There is no denying the short-term charts don’t look too rosy for the DJIA. I’ve covered that for the past couple of months. I decided to take a different perspective today and go back three years to see how the chart looked with less “noise”. Using monthly periods helps with that.
A trend line of higher lows aides the support (and cliff) for the large cap industrial index. The 20 mma and the trend line are starting to converge just as the Dow reaches this area. If the trend line breaks, the next area of support is close to 12,000. That’s not as severe as the moving average’s cliff, but 5-600 Dow points would irritate more than a few bulls. The support below that trend line coincides with the moving averages again, close to 11,000.
While the two indicators above give bulls some reason for hope, the Williams %R indicator isn’t being as friendly. The 14 and 28 month periods have fallen below overbought, signaling weakness. However, the 56 month indicator hasn’t rolled over yet. If the 20 mma and the trend line above don’t hold, expect a change in the 56 month’s indication.
I like using these longer charts for changes in the major cycles. We cannot rely on them for short term trades, but they are very useful in not being suckered in too early on a dead cat bounce deeper into the cycle. For now, the long term trend is still in play, but teetering. It all seems to come back to the fiscal cliff and what politicians do to us. The shorter-term signals I’ve written about recently have caused me to lighten my exposure some. A break in the longer-term signals will prompt me to open positions that are more bearish. This is no time to take major risks. It’s a time to preserve capital and be ready to jump with the momentum in either direction when we have better clarity.

